
Statistical TestsStatistical Test
Major Types of Statistical Tests
This section explains statistical hypothesis testing. A statistical test isa statistical method used to evaluate a hypothesis about a population based on sample data.Statistical tests are widely used in research papers, medical statistics, marketing analysis, quality control, educational evaluation, and many other fields. They play an important role in determining whether observed differences or associations are likely to reflect more than random variation.Statistical Tests
Several representative statistical tests are available depending on the purpose and characteristics of the data. Each is explained below.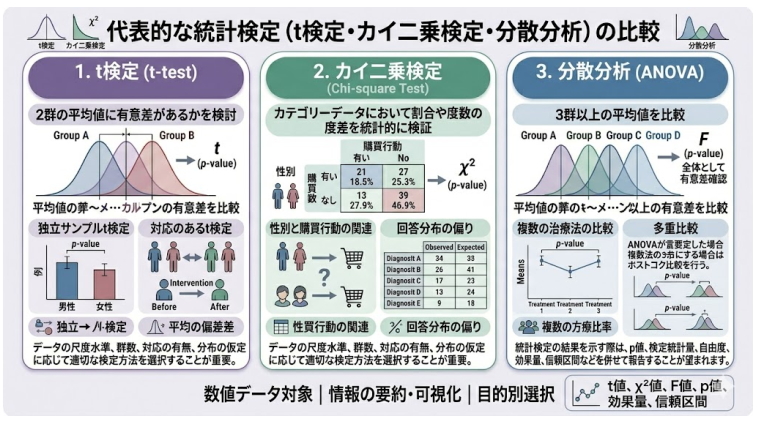
1. t-test:
A t-test isa representative hypothesis test used to examine whether the means of two groups differ significantly.It can be used to compare mean scores between a treatment and control group, mean values between two demographic groups, or numerical changes before and after an intervention. Independent-samples t-tests compare two independent groups, while paired t-tests compare repeated measurements from the same subjects. The t-test is widely used in academic research.
2. Chi-Square Test:
A chi-square test examines whether two categorical variables are associated or whether observed frequencies differ from expected frequencies. Examples include examining associations between gender and purchasing behavior, diagnostic category and treatment response, or deviations in response distributions. This method isuseful when statistically testing differences in proportions or frequencies..
3. Analysis of Variance (ANOVA):
ANOVA is used to compare means across three or more groups. Examples include comparing average effects among multiple treatments, mean scores among grade levels, or average sales among several stores. When the overall test is significant, multiple-comparison procedures may be used to identify which groups differ.
Other statistical tests include tests of correlation coefficients, nonparametric tests, F-tests, and power analysis.It is important to select a test appropriate to the measurement level, number of groups, paired or independent design, and distributional assumptions.When reporting statistical tests, it is generally desirable to report p-values together with test statistics, degrees of freedom, effect sizes, confidence intervals, and related information.
t-test
A t-test compares the means of two groups and evaluates whether the observed difference is statistically meaningful rather than likely due to random variation. It is a basic and important statistical test used in medicine, nursing, education, psychology, management, and many other fields.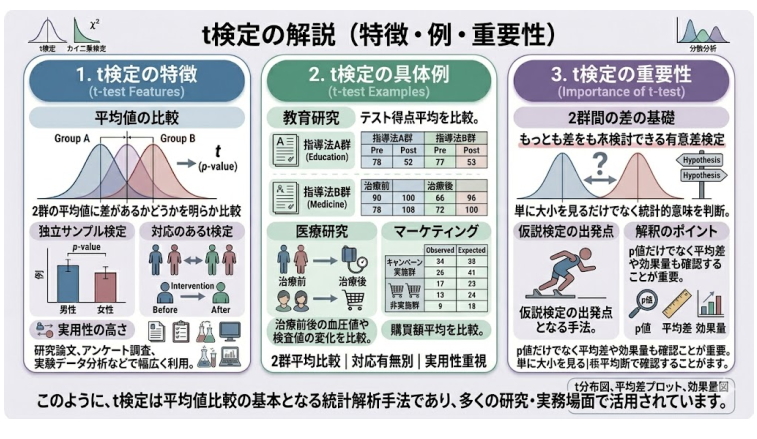
Characteristics of the t-test
Mean comparison: Determines whether two group means differ.
Selection based on pairing: The test differs depending on whether the groups are independent or the same participants are measured before and after an intervention.
Broad applicability: Widely used in research papers, questionnaire surveys, and experimental data analysis.
Examples of t-tests
Educational research: Compare mean test scores between teaching-method groups A and B.
Medical research: Compare blood pressure or laboratory measurements before and after treatment.
Marketing: Compare mean purchase amounts between campaign and non-campaign groups.
Importance of the t-test
A t-test isThe t-test is important as a basic significance test for examining differences between two groups.Rather than merely comparing mean values, it helps determine whether a difference is statistically meaningful and is a common starting point for hypothesis testing. Interpretation should consider not only the p-value but also the mean difference and effect size.
Thus, the t-test is a fundamental method for comparing means and is widely used in research and practice.
Chi-Square Test
A chi-square test examines distributions and associations in categorical data. Rather than comparing numerical means, it is used to test differences in frequencies or proportions or the independence of two categorical variables.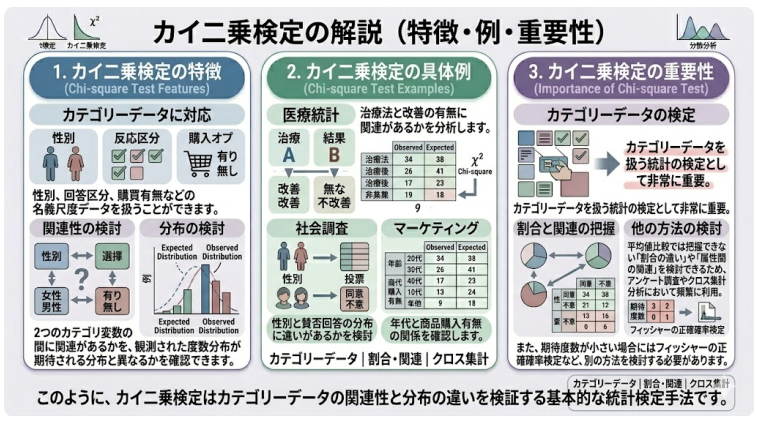
Characteristics of the Chi-Square Test
Suitable for categorical data: Can handle nominal data such as gender categories, response categories, and purchase/no-purchase outcomes.
Association testing: Evaluates whether two categorical variables are associated.
Distribution testing: Evaluates whether observed frequencies differ from an expected distribution.
Examples of Chi-Square Tests
Medical statistics: Analyze whether treatment type is associated with improvement status.
Social research: Examine whether the distribution of support/opposition responses differs by gender.
Marketing: Examine the relationship between age group and product purchase.
Importance of the Chi-Square Test
The chi-square test isextremely important for statistical testing of categorical data.Because it can examine differences in proportions and associations among attributes that cannot be assessed by comparing means, it is frequently used in questionnaire surveys and cross-tabulation. When expected cell counts are small, alternative methods such as Fisher's exact test may need to be considered.
Thus, the chi-square test is a basic statistical method for testing associations and distributional differences in categorical data.
Analysis of Variance (ANOVA)
Analysis of variance compares mean values across three or more groups and evaluates whether there is an overall statistically significant difference. Because multiple groups can be compared simultaneously, ANOVA is widely used in education, medicine, manufacturing, management, and other fields.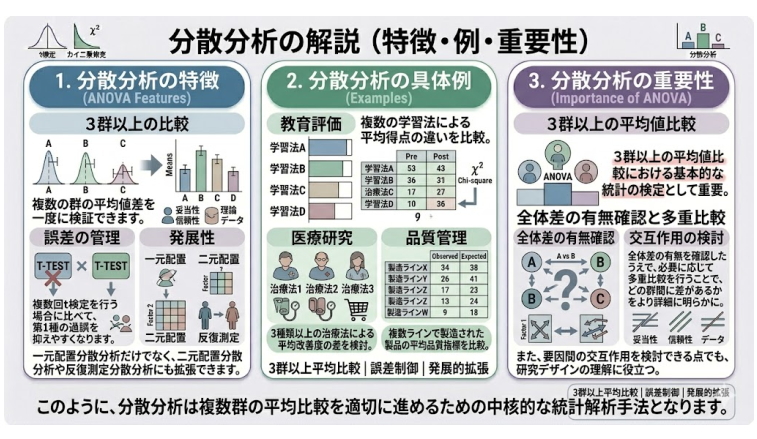
Characteristics of ANOVA
Comparison of three or more groups: Tests mean differences among multiple groups at once.
Error control: Compared with repeatedly performing t-tests, ANOVA helps control inflation of the Type I error rate.
Extensibility: In addition to one-way ANOVA, the framework extends to two-way and repeated-measures ANOVA.
Examples of ANOVA
Educational evaluation: Compare mean scores among several learning methods.
Medical research: Compare mean improvement among three or more treatments.
Quality control: Compare mean quality indicators among products manufactured on multiple production lines.
Importance of ANOVA
ANOVA isa fundamental statistical test for comparing means across three or more groups.After testing for an overall difference, multiple comparisons can be used when needed to identify which groups differ. ANOVA can also examine interactions among factors, making it useful for understanding research designs.
Thus, ANOVA is a core statistical method for appropriately comparing means across multiple groups.
Contact Us
Over 30,000 consultations / Over 19,000 completed engagements. To date, we have supported consultations and requests involving analysis outsourcing, statistical processing, questionnaire surveys, marketing support, and more. Our experienced consultants carefully listen to your needs so that we can provide the right support. We offer prompt and accurate work at reasonable, accessible rates and are committed to delivering dependable results. Stat Agent team members across Japan will take responsibility for supporting you.
*We provide the profile of the person responsible for your project when you apply.
For outsourced analysis and statistical processing, choose Stat Agent.
0476-85-7930
*When order volume is high, it may be difficult to reach us by phone.
We apologize for the inconvenience. We respond in order of receipt, so if your matter is urgent, please contact us byemail .
*When order volume is high, it may be difficult to reach us by phone.
We apologize for the inconvenience. We respond in order of receipt, so if your matter is urgent, please contact us by
