
Statistical Analysis / Quantitative AnalysisStatistical analysis / Quantitative analysis
Stat Agent accepts a wide range of consultations regardingStatistical AnalysisWe accept a wide range of inquiries concerning these services. For questionnaire surveys, research data, experimental data, operational data, and more, you can consult us about selecting appropriate analytical methods, interpreting results, creating graphs, and organizing findings for reports.
Quantitative analysis requires more than simply producing numbers with software. It is important toselect analytical methods that fit the research objective,、understand how to interpret the results, and、determine how to present them in figures, tables, and text.We therefore emphasize analytical design suited to the purpose, including SEM, multivariable analysis, factor analysis, principal component analysis, analysis of variance, and various statistical tests.
In recent years, it has also become more common to use generative AI or automated analysis tools to prepare preliminary statistical outputs. However, AI-generated analytical results may containinappropriate method selection, overlooked assumptions, incorrect interpretation, or unnatural use of statistical terminology.In academic research and practical analysis in particular, assumptions and validity of statistical tests must be checked. Professional review is therefore essential rather than using AI output without verification.
For this reason, Stat Agent emphasizesStat Agent emphasizes having experienced staff review the analytical objective, data structure, and outputs directly and refine them into an appropriate analytical design and interpretation.We can also improve results already created with AI or statistical software, organize interpretations, and adjust presentation for reports or academic papers.
We provide statistical and quantitative analysis support for people who are unsure which method to use, have obtained results but lack confidence in their interpretation, or want AI-generated analytical findings reviewed professionally.
Types of Statistical / Quantitative Analysis
[Main Consultation Categories]
| Analysis Category | Main content | Where human expertise is difficult to replace with AI | Review and Refinement of AI Analysis / Existing Outputs |
|---|---|---|---|
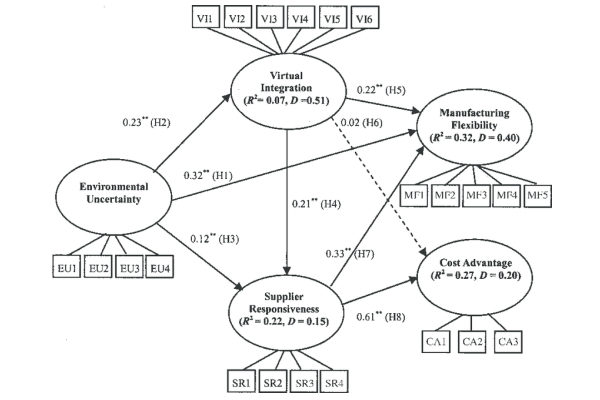
| Structural Equation Modeling (SEM) |
• Multiple regression / regression-based path-analysis models • Factor-analysis models with latent variables • Multiple-indicator models (typical covariance-structure models) |
These analyses require judgment aboutthe validity of the research design,including how theoretical hypotheses connect to measurement and structural models. | We review AI-generated drafts of SEM interpretations, including fit indices, path coefficients, and the meaning assigned to latent variables, and refine them into academically appropriate explanations. |
| Multivariable Analysis |
• Correlation analysis • Multiple regression and regression analysis • Correspondence analysis • Quantification methods (Types I–III) • Discriminant analysis • Probit regression • Binary logistic regression |
These analyses require judgment about assumptions such as the relationship between the dependent and explanatory variables, measurement levels, and the direction of interpretation.including how theoretical hypotheses connect to measurement and structural models. | We can refine AI-generated explanations of regression or logistic-regression results, correcting interpretation of coefficients, odds ratios, and statistical significance. |
| Scale Construction / Exploratory Analysis |
• Principal component analysis • Factor analysis • Cronbach's alpha • Cluster analysis |
These analyses require decisions aligned with the research objective, such as determining the number of factors, assessing whether item deletion is appropriate, and handling reliability.This requires more than automated method selection. | We reorganize AI-generated descriptions of factor-analysis findings or reliability coefficients, including the validity of factor-loading interpretations and item-deletion decisions. |
| Estimation and Hypothesis Testing |
• Estimation and testing of a population mean • Estimation and testing of a population variance • Estimation and testing of a population proportion |
Even basic statistics require judgment regardinghypothesis formulation, testing assumptions, and sample conditions. | We organize descriptions of test results, p-values, confidence intervals, and estimates in clear language suitable for papers and reports. |
| Two-Sample Comparisons |
• Test of a difference between population means • Paired difference test • Test of homogeneity of variance • Test of a difference between population proportions • Meta-analysis of differences between population means • Median test • Mann–Whitney U test • Brunner–Munzel test • Two-sample Kolmogorov–Smirnov test • Sign test • Wilcoxon signed-rank test |
Appropriate test selection must account for paired versus independent data, distribution, and measurement level, andautomated selection is often insufficient. | We review AI-generated descriptions of comparison results, including whether the selected test is appropriate and whether the findings are worded accurately. |
| Analysis of Variance / Multiple Comparisons |
• One-way ANOVA • One-way repeated-measures ANOVA • Two-way ANOVA • Two-way repeated-measures ANOVA • Factorial ANOVA • Repeated-measures factorial ANOVA • Analysis of covariance (ANCOVA) • Multivariate analysis of variance (MANOVA) • Analysis of an orthogonal array (L8 orthogonal array) • Construction of orthogonal arrays • Randomized block design • Paired comparisons |
Interpreting main effects, interactions, and multiple comparisons is highly dependent onthe context of the results. | We refine ANOVA output into clear explanations of main effects and interactions aligned with the research objective. |
| Nonparametric Tests |
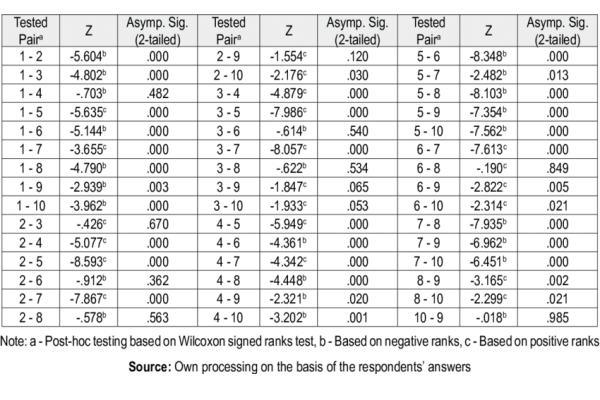
• Median test • Mann–Whitney U test • Brunner–Munzel test • Two-sample Kolmogorov–Smirnov test • Sign test • Wilcoxon signed-rank test • Kruskal–Wallis test and multiple comparisons • Friedman test • Cochran's Q test • Jonckheere–Terpstra test |
These methods require careful assessment of assumptions,including when to use them instead of parametric methods and whether rank-based analysis is appropriate.This requires more than automated method selection. | We can review the validity of statistical tests selected by AI and prepare natural descriptions of rank-test results. |
| Graphing / Visualization |
• Scatterplots with labels or stratification • Vertical line graph (snake chart) • Changing the data range of a vertical line graph • Mosaic plot • Lorenz curve and Gini coefficient • Ternary plot • Pyramid chart |
Visualization requires design judgment aboutwhich type of figure communicates the result most effectively.This requires more than automated method selection. | We can improve AI-generated graphs or existing figures by organizing axes, legends, labels, and presentation for reports or academic papers. |
[Other Consultation Types]
• Data cleaning, missing-value checks, and outlier checks
• Variable design, dummy coding, and scale-score construction
• Cross-tabulation, simple tabulation, and organization of basic descriptive statistics
• Preparation of questionnaire results for reports
• Formatting tables and figures for journal submissions
• Organizing results slides for conference presentations
• Reviewing AI-generated analysis reports
• Refinement of AI-generated interpretation text into natural, professional language
• Reconstructing statistical-software output tables for readability
• Recommending analytical methods again based on the research objective
* We also support analyses not listed above and partial requests.
You can consult us not only about analyses performed with statistical software, but also solely about improving AI-generated or existing outputs..
Depth of Analytical Design and Interpretation Support
Examples of Levels of Statistical / Quantitative Analysis Support
•Basic Analysis SupportSimple tabulation, cross-tabulation, descriptive statistics, and organization of basic comparative analyses
•Standard Analysis SupportConducting and organizing results from regression analysis, factor analysis, principal component analysis, ANOVA, and similar methods
•Advanced Analysis SupportSEM, logistic regression, models with interaction terms, and review of scale construction
•Research and Publication SupportOrganization of result expression, preparation of figures and tables, and structuring of results text for manuscripts
•AI Analysis Refinement SupportRefinement of AI-generated interpretation text or automated reports into academically and practically appropriate form
•Report / Presentation SupportRestructuring findings into a clear form for research presentations, academic conferences, or internal corporate reports
What matters most in analysis is not merely producing numbers, but designing the analysis appropriately for the purpose and interpreting it correctly. We therefore emphasize support that also considers assumptions and the meaning of the results.
Customizing Your Request
Statistical and quantitative analysis support can be flexibly customized according tothe data format, sample size, number of items, analytical objective, and required delivery format.We can organize results for research, publication, internal corporate reporting, conference presentations, and other uses.
| Customization Item | Description |
|---|---|
| Electronic and Paper-Based Data Supported | We accept electronic data as well as analyses that require digitization of paper-based data. |
| Consultation on analytical methods | We can work with you to organize appropriate analytical methods according to your research objectives and hypotheses. |
| Formatting of Result Tables and Figures | We format deliverables for readability according to their purpose, including journal submission, conference presentation, or internal corporate reporting. |
| Review of AI-Generated Analysis Results | We can improve awkward wording, overlooked assumptions, and insufficient explanation in AI-generated analysis reports and interpretation text. |
| Reorganization of Software Output | Output tables from SPSS, R, Stata, Excel, and similar tools can be reorganized into a form that is easier to read and report. |
| Partial Requests | Partial requests are also accepted, such as tabulation only, graphing only, interpretation only, or drafting results text only. |
* The supported scope and any additional fees vary by request. If you provide the sample size, number of items, data format, and analytical objective, we can give more appropriate guidance.
Indicative Fees

| Item | Description | Notes |
|---|---|---|
| Multiple Regression Analysis | Sample size of 50 or fewer; 5 or fewer variables \25,800 |
This is a basic price guideline assuming electronic data. |
| Multiple Regression Analysis of Paper-Based Data | Sample size of 50 or fewer; 5 or fewer variables \37,800 |
This is a guideline when digitization of paper-based data is required. |
| Principal Component Analysis | Sample size of 50 or fewer; 5 or fewer variables \25,800 |
This is a basic price guideline assuming electronic data. |
| Principal Component Analysis of Paper-Based Data | Sample size of 50 or fewer; 5 or fewer variables \37,800 |
This is a guideline when digitization of paper-based data is required. |
| AI Analysis Refinement | Quoted individually | Review of AI-generated analysis reports, interpretation text, and output tables is quoted according to the content. |
| When pricing may vary | Fees may also vary with larger sample sizes or item counts, more advanced analyses, and additional figure/table formatting. | If you are unsure of the approximate price, we can advise you even if you provide only the general scale of the project. |
| Check the Fee Schedule | → View the Fee Schedule | You can also review other analytical and related services. |
You can consult us even at the stage of asking “Which analysis is appropriate for my data?” or “I want a professional review of results generated by AI.”.
Providing the sample size, number of items, data format, and analytical objective allows us to give more specific guidance.
Contact Us
Over 30,000 consultations / Over 19,000 completed engagementsWe have supported consultations and requests involving analysis outsourcing, statistical processing, survey research, marketing support, and related services. Our experienced consultants carefully listen to your needs andAnalytical design, result organization, visualization, and review of AI analysisStat Agent team members across Japan take responsibility for supporting our clients.
*We provide the profile of the person responsible for your project when you place an order.
Analysis Outsourcing and Statistical Processing | Stat Agent
*When order volume is high, it may be difficult to reach us by phone.
We apologize for the inconvenience. We respond in order of receipt, so if your matter is urgent, please contact us by
