
Multivariate Analysis (Methods for Numerical Data)Multivariate Analysis
Major Types of Multivariate Analysis
This section explains multivariate analysis in statistics. Multivariate analysis is a general term for analytical methods that simultaneously handle multiple numerical variables to clarify relationships, structures, and the magnitude of effects among them. Because multiple variables can be considered together rather than one at a time, these methods are used in academic research, medical statistics, marketing analysis, quality control, psychological scale evaluation, and many other fields.Multivariate Analysis (Methods for Numerical Data)
There are several representative multivariate methods depending on the purpose. Each is explained below.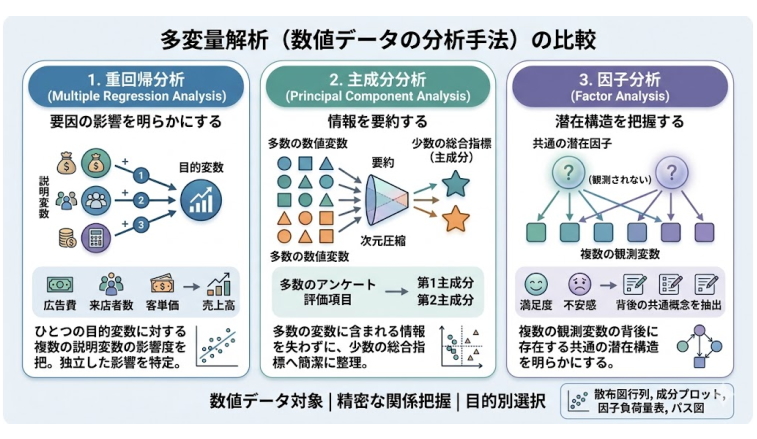
1. Multiple Regression Analysis:
Multiple regression uses one numerical outcome variable and examines how multiple numerical explanatory variables are associated with it. For example, it can be used to analyze the extent to which advertising expenditure, number of visitors, and average spending per customer relate to sales. By controlling for other variables, the method can estimate the independent association of each predictor with the outcome. It is widely used in research papers and practical data analysis.
2. Principal Component Analysis:
Principal component analysis summarizes information contained in many numerical variables into a smaller number of composite components while retaining as much information as possible. For example, results from a questionnaire with many evaluation items can be summarized into a few principal components, making the overall characteristics of the data easier to understand. The method is useful for simplifying complex, high-dimensional data.
3. Factor Analysis:
Factor analysis identifies common latent factors underlying multiple observed numerical variables. For example, when multiple questionnaire items reflect common constructs such as “satisfaction” or “anxiety,” factor analysis can extract the underlying factors. It is especially important for scale development and examining questionnaire structure and is widely used in psychology, nursing, education, and related fields.
Unlike methods designed for qualitative data, these multivariate analyses can model relationships among numerical variables more precisely. Multiple regression examines the influence of predictors, principal component analysis summarizes information, and factor analysis examines latent structure. Selecting a method appropriate to the research objective is important. Scatterplot matrices, component plots, factor-loading tables, and path diagrams are often used to visualize multivariate results.
Multiple Regression Analysis
Multiple regression analysis simultaneously includes multiple explanatory variables for one continuous outcome and examines their relationships with that outcome. It is a representative multivariable method used in medicine, management, education, social research, and many other fields.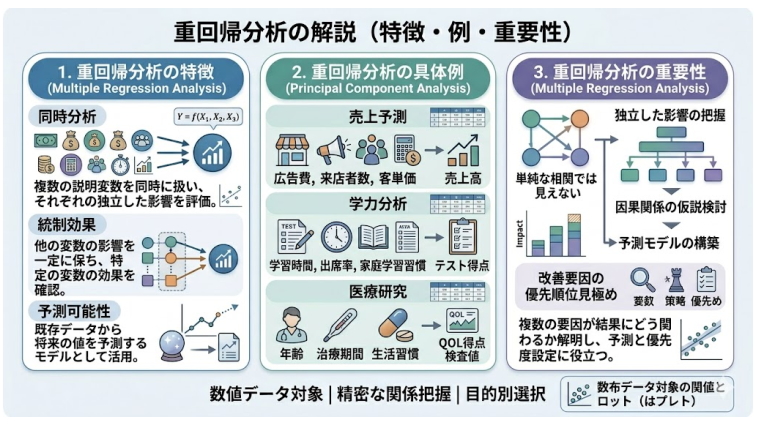
Characteristics of Multiple Regression Analysis
Simultaneous analysis: By handling multiple explanatory variables at the same time, the association of each variable with the outcome can be assessed separately.
Adjustment: The effect of a specific variable can be examined while holding other variables constant.
Prediction: The model can also be used to predict future values from existing data.
Examples of Multiple Regression Analysis
Sales prediction: Use sales as the outcome and advertising expenditure, number of visitors, and average spending per customer as explanatory variables.
Academic-performance analysis: Use test score as the outcome and study time, attendance rate, and home-study habits as explanatory variables.
Medical research: Use QOL scores or laboratory values as outcomes and examine associations with age, treatment duration, lifestyle, and related factors.
Importance of Multiple Regression Analysis
Multiple regression is very important for understanding how multiple factors are associated with an outcome. Because it can identify adjusted associations that may not be visible in simple correlation analysis, it is useful for examining causal hypotheses and building predictive models. In practice, it can also provide a basis for prioritizing factors to improve.
Thus, multiple regression is a representative statistical method for quantitatively understanding relationships among numerical variables and can be used for both explanation and prediction.
Principal Component Analysis
Principal component analysis summarizes many numerical variables into a smaller number of composite variables, making the overall structure of the data easier to understand. Even when there are many variables, it can simplify the data while retaining much of the original information.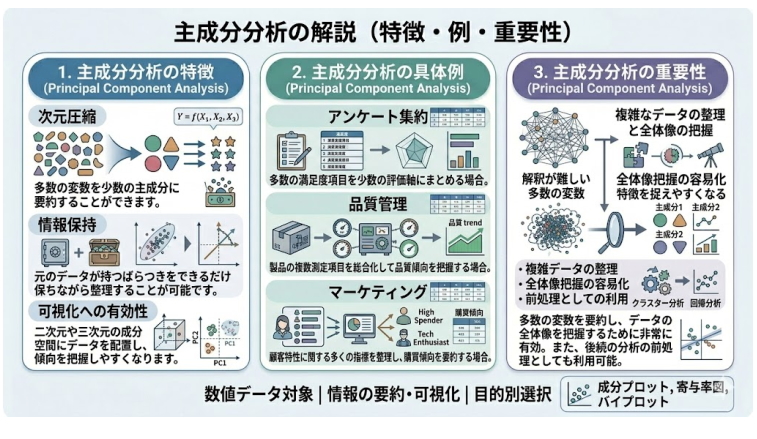
Characteristics of Principal Component Analysis
Dimensionality reduction: Many variables can be summarized into a small number of principal components.
Information retention: The method can preserve as much of the variation in the original data as possible while simplifying it.
Useful for visualization: Data can be placed in a two- or three-dimensional component space to make patterns easier to see.
Examples of Principal Component Analysis
Questionnaire summarization: Combining many satisfaction items into a smaller number of evaluation dimensions.
Quality control: Integrating multiple product measurements to understand overall quality patterns.
Marketing: Organizing many customer-characteristic indicators to summarize purchasing tendencies.
Importance of Principal Component Analysis
Principal component analysis is highly useful for organizing complex data and understanding the overall picture. Data with many variables can be difficult to interpret directly, but summarizing them into principal components makes the main characteristics easier to grasp. PCA is also sometimes used as preprocessing before cluster or regression analysis.
Thus, principal component analysis is a fundamental multivariate method for efficiently organizing many numerical variables and making the characteristics of the data easier to understand.
Factor Analysis
Factor analysis identifies common factors underlying multiple observed variables and is especially useful for scale construction and understanding conceptual structure. Its purpose is to explore latent structure behind observed numerical data.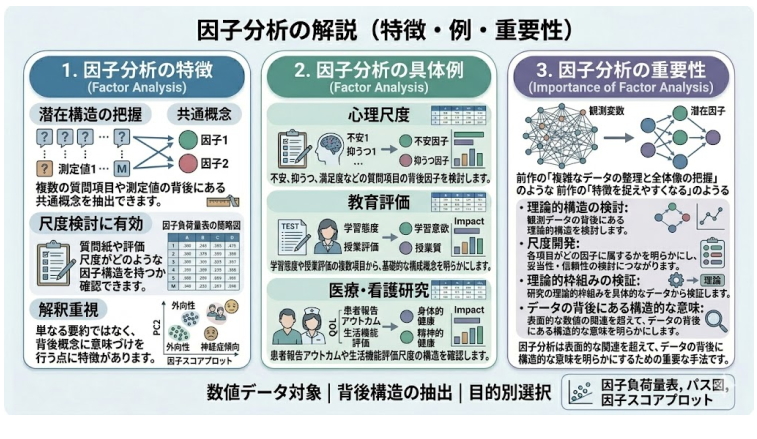
Characteristics of Factor Analysis
Identification of latent structure: Common concepts underlying multiple questionnaire items or measurements can be extracted.
Useful for scale evaluation: The factor structure of questionnaires or rating scales can be assessed.
Interpretation-focused: Unlike simple data reduction, factor analysis emphasizes assigning substantive meaning to latent constructs.
Examples of Factor Analysis
Psychological scales: Examine factors underlying questionnaire items related to anxiety, depression, satisfaction, and similar constructs.
Educational evaluation: Identify underlying constructs from multiple items concerning learning attitudes or course evaluation.
Medical and nursing research: Examine the structure of patient-reported outcomes or functional-status scales.
Importance of Factor Analysis
Factor analysis is essential for examining theoretical structures underlying observed numerical data. In questionnaire research and scale development in particular, clarifying which items belong to which factors contributes to evaluating validity and reliability. It is also useful for testing theoretical frameworks against empirical data.
Thus, factor analysis is an important multivariate method for clarifying structural meaning behind data beyond surface-level numerical relationships.
Contact Us
Over 30,000 consultations / Over 19,000 completed engagements. To date, we have supported consultations and requests involving analysis outsourcing, statistical processing, questionnaire surveys, marketing support, and more. Our experienced consultants carefully listen to your needs so that we can provide the right support. We offer prompt and accurate work at reasonable, accessible rates and are committed to delivering dependable results. Stat Agent team members across Japan will take responsibility for supporting you.
*We provide the profile of the person responsible for your project when you apply.
For outsourced analysis and statistical processing, choose Stat Agent.
0476-85-7930
*When order volume is high, it may be difficult to reach us by phone.
We apologize for the inconvenience. We respond in order of receipt, so if your matter is urgent, please contact us byemail .
*When order volume is high, it may be difficult to reach us by phone.
We apologize for the inconvenience. We respond in order of receipt, so if your matter is urgent, please contact us by
