
Types of DataData Type
Major Categories of Data
This section explains types of data in statistics. Statistical data are mainly classified into“qualitative (categorical) data” and “quantitative (numerical) data.”Qualitative Data (Categorical Data)
Qualitative data (categorical data) includenominal and ordinal scales.Each is explained in more detail below.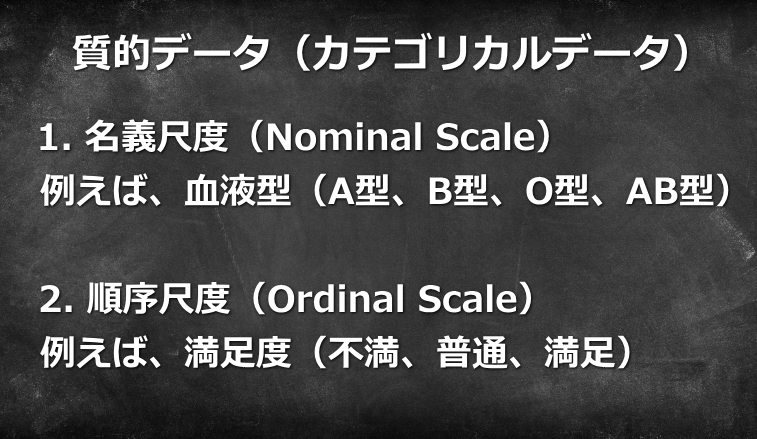
1. Nominal Scale:
A nominal scale is used to classify data into categories. The values have no intrinsic ordering or magnitude; they function only as labels identifying categories. Examples include gender categories, blood type (A, B, O, AB), and occupation (teacher, physician, engineer). Such data are often used for tabulation and comparisons by category, but numerical operations such as addition and multiplication are not meaningful.
2. Ordinal Scale:
An ordinal scale consists of qualitative categories with a clear order. Categories can be ranked as “higher” or “lower,” but the magnitude of the differences between categories is not quantified. Examples include educational level, satisfaction ratings, and pain severity. These data are used for rank-based analyses and statistical methods in which ordering is meaningful.
Common methods for qualitative data include frequency tables, chi-square tests, and multiple correspondence analysis. These methods help clarify data structure, relationships, patterns, and trends. Bar charts, pie charts, and heatmaps are also often used to visualize categorical data.
Quantitative Data (Numerical Data)
Quantitative data include interval and ratio scales. Their characteristics and uses are described below.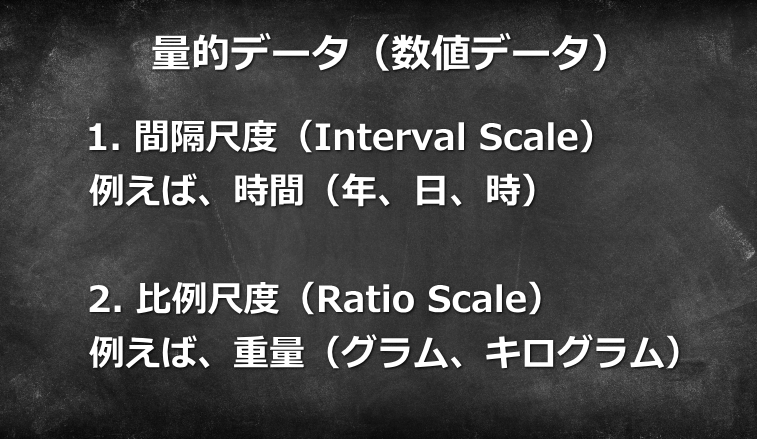
1. Interval Scale:
On an interval scale, differences between numerical values are meaningful, but there is no true zero point, so ratios such as “twice as much” are not meaningful. Temperature measured in Celsius or Fahrenheit is a typical example. The difference between 20°C and 30°C is 10 degrees, but 30°C cannot be said to be 1.5 times as warm as 20°C. Calendar time is another example. Addition and subtraction of intervals are meaningful, while ratio interpretations require care.
2. Ratio Scale:
A ratio scale has meaningful numerical differences and a true zero point, so ratios are also meaningful. Examples include weight, distance, and income. All basic arithmetic operations can be meaningfully applied. This makes it possible to calculate statistics such as the mean, median, variance, and standard deviation and to perform detailed quantitative analyses.
Quantitative data can be examined with histograms or boxplots to understand distributions, and scatterplots or line graphs to identify trends. More advanced methods such as correlation analysis, regression analysis, and factor analysis can be used to explore relationships among variables.
Understanding measurement scales appropriately and selecting suitable statistical methods helps deepen insight from data and supports more effective decision-making.
Flow Data
Flow data are datameasured over a specified time intervaland represent flows of economic transactions or activities. Because they capture the amount of a phenomenon or activity occurring during a period, flow data are important in economics, accounting, statistics, and many other fields.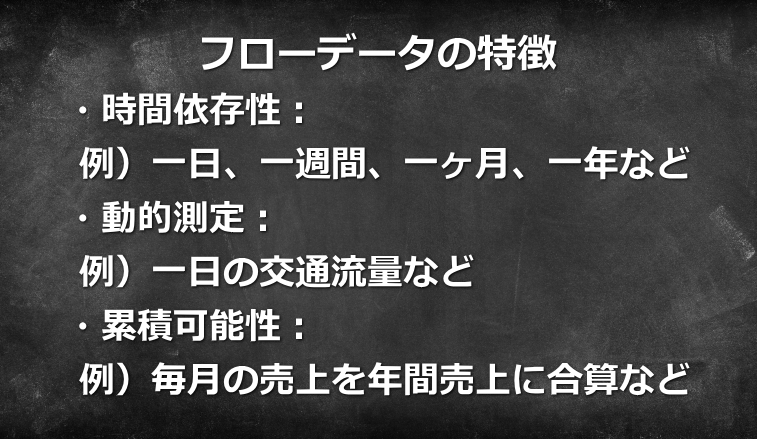
Characteristics of Flow Data
Time dependence: Flow data depend on time and are measured over a specified period, such as a day, week, month, or year.
Dynamic measurement: Flow data track movement or change over time. Examples include quarterly company sales, daily traffic volume, or weekly rainfall.
Additivity over time: Flow data can be accumulated across periods. For example, monthly sales can be summed to obtain annual sales.
Examples of Flow Data
GDP (Gross Domestic Product): The total value of economic activity within a country during a specified period, measuring total production of goods and services. GDP is a typical flow variable and is widely used as an indicator of economic performance.
Income: Monetary gains earned by an individual or organization over a specified period, including wages, interest income, and dividends.
Expenditure: Money spent by consumers or organizations on goods and services during a specified period, such as monthly household consumption expenditure or annual government expenditure.
Importance of Analyzing Flow Data
Analysis of flow data ishighly useful for understanding trends and patterns over time.It plays an important role in decision-making processes such as analyzing economic growth rates, tracking market trends, and evaluating fiscal policy. Flow data are also used in predictive models to forecast future trends and economic conditions.
In this way, flow data are a fundamental source for understanding the scale and pace of activities in different aspects of the economy and society within a temporal context.
Stock Data
Stock data indicate the amount of a resource or value at a specific point in time and are used in economics, accounting, statistics, and other fields. They are static measurements capturing a state at a particular moment rather than a flow through time.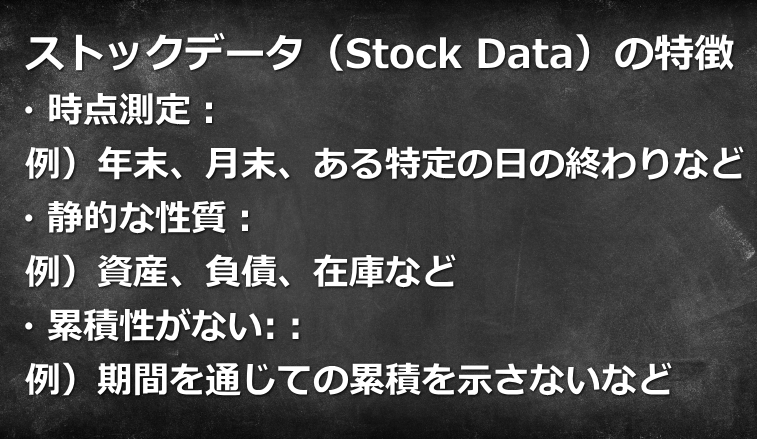
Characteristics of Stock Data
Point-in-time measurement: Stock data measurea quantity or state at a specific point intime, such as the end of a year, the end of a month, or the end of a particular day.
Static nature: Stock data do not represent a dynamic flow; they describe the state at a point in time. This allows assets, liabilities, inventory, and other quantities to be measured clearly.
Not cumulative over periods: Unlike flow data, stock data do not represent accumulation throughout a period, so comparisons are primarily made between points in time.
Examples of Stock Data
Bank balance: The balance in an individual or organization's bank account on a particular date, reflecting financial status at that point in time.
Inventory in a warehouse: The amount of goods or raw materials held at the end of a given day, an important source of information for inventory management and demand forecasting.
Population: The total number of people in a region or country at a specific point in time, used in demographic analysis and public-policy planning.
Importance of Analyzing Stock Data
Stock-data analysis is essential for evaluating the condition of organizations and economies. Accurate point-in-time information about assets, liabilities, inventory, and similar measures supports more effective resource allocation and risk management. Demographic stock data are also essential for designing public policies in education, health, and welfare.
Because of their static nature, stock data serve as a “snapshot” of economic or social conditions. Comparing stock measures at different points in time can also reveal changes and trends over time.
Contact Us
Over 30,000 consultations / Over 19,000 completed engagements. To date, we have supported consultations and requests involving analysis outsourcing, statistical processing, questionnaire surveys, marketing support, and more. Our experienced consultants carefully listen to your needs so that we can provide the right support. We offer prompt and accurate work at reasonable, accessible rates and are committed to delivering dependable results. Stat Agent team members across Japan will take responsibility for supporting you.
*We provide the profile of the person responsible for your project when you apply.
For outsourced analysis and statistical processing, choose Stat Agent.
0476-85-7930
*When order volume is high, it may be difficult to reach us by phone.
We apologize for the inconvenience. We respond in order of receipt, so if your matter is urgent, please contact us byemail .
*When order volume is high, it may be difficult to reach us by phone.
We apologize for the inconvenience. We respond in order of receipt, so if your matter is urgent, please contact us by
