
Statistical Inference Beyond the p-Value
For those who want to interpret statistical results in undergraduate theses, master’s theses, journal submissions, and research reports using not only p-values but also effect sizes, confidence intervals, Bayesian perspectives, and reproducibility
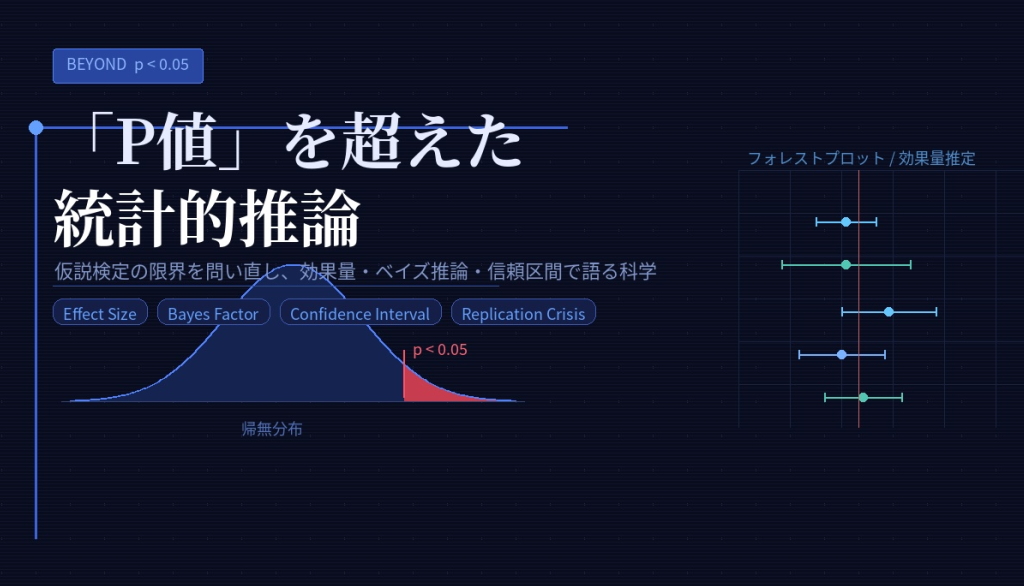
When reviewing statistical analysis results, the first value many people check is the p-value. A common convention in undergraduate theses, master’s theses, journal articles, medical papers, nursing research, psychology research, education research, social surveys, and marketing research is to write that p < 0.05 indicates a “statistically significant difference,” while p ≥ 0.05 indicates “no statistically significant difference.”
However, there are limitations to judging the value of research findings solely by the p-value. A p-value is neither the probability that the research hypothesis is correct, nor the magnitude of an effect, nor the practical importance of a result. A small p-value does not necessarily imply a large effect, and a p-value just above 0.05 does not necessarily mean that the finding is meaningless.
Contemporary statistical inference requires an integrated view of p-value.、 effect size,、 confidence intervals,、 statistical power,、 sample size,、 Bayesian statistics,、 reproducibility,、 and clinical or practical significance. These elements should be considered together.
This article is intended for readers considering Statistical inference beyond the p-value、 p-value meaning、 p-value misconceptions、 statistical significance、 how to report effect size、 confidence interval interpretation、 Bayesian statistics,、 how to report statistical analysis in a paper This article is intended for readers searching for these topics and explains in concrete terms how to move one step beyond p-value-centered interpretation.
The first point to understand is that The key point is that a p-value does not directly indicate whether a result is important; rather, it is an index of how unusual the observed data are under an assumed statistical model. To interpret research findings, it is necessary to examine not only the p-value but also effect size, confidence intervals, study design, sample size, and consistency with prior research.
- • What is a p-value?
- • Why p-values alone are insufficient
- • Difference between statistical significance and practical significance
- • Statistical inference using effect sizes
- • How to interpret results using confidence intervals
- • Statistical power and sample size
- • Expanding inference with Bayesian statistics
- • Importance of reproducibility and preregistration
- • How to report results beyond p-values in a paper
- • Examples of reporting statistical analysis results
- • Common problematic statements about p-values
- • Statistical-inference support available from Stat Agent
- • Frequently Asked Questions
- • Summary
What is a p-value?
A p-value is the probability, assuming the null hypothesis is true, of obtaining the observed data or data more extreme than what was observed. For example, in a t-test comparing the means of two groups, the p-value evaluates how likely it would be to observe a difference as large as, or larger than, the observed difference if there were truly no difference between the groups.
Conventionally, a result may be regarded as statistically significant when p < 0.05. However, this 0.05 threshold is not an absolute truth. Interpretation depends on the research field, study design, nature of the hypothesis, whether the study is exploratory or confirmatory, and the magnitude of the relevant risks.
What a p-value tells us
A p-value provides information about how incompatible the observed data are with the null hypothesis and the assumed statistical model. The smaller the p-value, the less likely the observed data would be under the null hypothesis.
For example, a p-value of 0.01 means that, assuming the null hypothesis is true, the probability of obtaining data like those observed, or more extreme data, is about 1%. It does not mean that “the research hypothesis is 99% likely to be correct.”
What a p-value does not tell us
A p-value does not indicate the probability that the research hypothesis is true. Nor does it directly indicate effect magnitude, importance of the result, reproducibility, clinical significance, or practical value.
For example, in a very large study, even a trivial difference can produce a small p-value. Conversely, in a small study, a practically meaningful difference may fail to produce p < 0.05. For this reason, results should not be judged as “meaningful” or “meaningless” based on the p-value alone.
Why p-values alone are insufficient
P-values alone are insufficient because they indicate statistical unusualness but not the magnitude or practical meaning of a result. What researchers truly want to know is not merely whether a difference exists. They also need to consider how large the difference is, whether it matters in practice, whether it is consistent with prior research, and whether it is likely to be reproduced in another sample.
For example, in education research evaluating a new learning program, a p-value of 0.04 may accompany a mean difference of only 0.5 points, in which case the practical meaning may be limited. Conversely, even with p = 0.07, a moderate effect size and a confidence interval that includes practically important values may provide implications worth pursuing in future research or practice.
Accordingly, statistical inference should use the p-value as one starting point while evaluating effect size, confidence intervals, study design, sample size, and theoretical validity in an integrated manner. .
Difference between statistical significance and practical significance
Statistical significance refers to a state in which an observed difference or association is judged difficult to explain by chance alone. Practical significance, by contrast, concerns the extent to which the difference or association matters in practice, clinical care, education, policy, management, or research.
Statistical significance and practical significance do not necessarily coincide. Even when the p-value is small, an extremely small effect may have limited practical meaning. Conversely, a result that does not cross the 0.05 threshold may still have important implications depending on the population and practical context.
When the p-value is small but the effect is small
In studies using very large datasets, even extremely small differences can become statistically significant. For example, with data from tens of thousands of observations, a tiny difference in means may yield a small p-value. Whether that difference is large enough to matter in practice or justify a policy or intervention change is a separate question.
In such cases, effect size should be examined in addition to the p-value. Effect sizes make it possible to quantify the magnitude of a difference or the strength of an association.
When an important implication exists despite a non-significant p-value
In small-sample studies, a practically important difference may fail to reach statistical significance. This is especially relevant in medical studies with limited case numbers, nursing research, educational practice research, regional studies, and exploratory research, where it is inappropriate to dismiss findings based solely on the p-value.
In these situations, the meaning of the result should be discussed cautiously while considering effect size, confidence intervals, participant characteristics, study design, and consistency with prior studies. Rather than ending with “there was no significant difference,” it is important to report the magnitude of the observed difference and the degree of uncertainty.
Statistical inference using effect sizes
An effect size is an index of the magnitude of a difference or the strength of an association. Whereas the p-value indicates how unusual the data are under the null hypothesis, an effect size indicates how large the difference or association is.
| Analysis setting | Commonly used effect sizes |
|---|---|
| Comparison of means between two groups | Cohen’s d, mean difference, standardized mean difference |
| Correlation Analysis | Correlation coefficient r, coefficient of determination r² |
| Analysis of variance | η², partial η² |
| Cross-tabulation | Odds ratio, risk ratio, Cramer’s V |
| Regression analysis | Regression coefficient, standardized regression coefficient, odds ratio, coefficient of determination |
Reporting effect size helps readers understand the magnitude of a finding. Writing only “the result was significant at p = 0.03” does not show how large the difference was. By contrast, stating that “the intervention group scored an average of 5.2 points higher than the control group, with Cohen’s d = 0.48” communicates both direction and magnitude.
In undergraduate theses, master’s theses, and journal submissions, reporting effect size in addition to the p-value makes interpretation more persuasive. Effect sizes can also help explain the meaning of findings carefully when no statistically significant difference is observed.
How to interpret results using confidence intervals
A confidence interval is a range that expresses uncertainty around an estimate. For example, if the mean difference is 5.2 points with a 95% confidence interval from 1.1 to 9.3, the estimated mean difference is uncertain, with a plausible range of approximately 1.1 to 9.3 based on the observed data.
Confidence intervals provide information that p-values alone do not. For example, even if p = 0.04 is statistically significant, a very wide confidence interval may indicate low precision. Conversely, even if p = 0.06 is not statistically significant, a confidence interval containing many practically important values may indicate that further research is worthwhile.
In a paper, rather than simply writing that “there was a significant difference,” present the estimate, 95% confidence interval, and p-value together. This makes both the magnitude of the result and its uncertainty easier to understand.
Statistical power and sample size
Statistical power is the probability of detecting an effect when an effect truly exists. In a study with low power, a real effect may fail to produce a statistically significant p-value. Therefore, when interpreting a non-significant result, it is necessary to consider whether the sample size was adequate.
In a small-sample study, “no statistically significant difference” does not necessarily mean that no effect exists. The study may simply have lacked sufficient power to detect the difference. Conversely, in a very large study, even practically small differences are more likely to become statistically significant.
At the study-planning stage, sample size is considered in light of the expected effect size, acceptable Type I error rate, statistical power, and study design. When interpreting results, it is also important to understand how sample size affects the p-value.
Expanding inference with Bayesian statistics
Bayesian statistics offers an approach that can complement p-value-centered statistical inference. Bayesian analysis combines a prior distribution with observed data to obtain a posterior distribution. This allows uncertainty about hypotheses or parameters after observing the data to be represented explicitly.
A key feature of Bayesian statistics is that uncertainty in estimates can be handled as a probability distribution. For example, it can facilitate examination of “the probability that the effect is greater than zero,” “the probability that the effect lies in a practically meaningful range,” or “which of multiple models is more compatible with the data.”
However, Bayesian statistics does not automatically produce correct conclusions. The choice of prior distribution, model validity, sensitivity analysis, and explanation of results all require careful consideration. Bayesian statistics is not necessarily required for undergraduate or master’s theses, but it is important to understand that there are ways to express uncertainty other than p-values. This broader perspective is valuable.
Importance of reproducibility and preregistration
Reproducibility is another important perspective in statistical inference beyond the p-value. Even if p < 0.05 in one study, the same finding may not appear in another dataset or sample. In particular, if many exploratory analyses are performed and only statistically significant results are emphasized, chance findings may be overvalued.
To reduce this problem, it is useful to specify the research hypotheses, primary outcomes, analytical methods, and exclusion criteria in advance. In fields such as medical and psychological research, preregistration of study and analysis plans has also become increasingly common.
Improving reproducibility requires transparent reporting of data-collection methods, analysis code, preprocessing, missing-data handling, outlier handling, and sensitivity-analysis strategies. Statistical inference is supported not only by p-values but also by the transparency of the overall research process.
How to report results beyond p-values in a paper
When reporting statistical analysis results in a paper, do not simply list p-values. Report the estimates, effect sizes, confidence intervals, statistical tests, sample size, and research meaning together. In particular, the Results section should present numerical findings objectively, while the Discussion should explain their meaning in relation to prior research and practical significance.
| Information to report | Specific content |
|---|---|
| Statistical test | t-test, analysis of variance, chi-square test, correlation analysis, regression analysis, etc. |
| Estimate | Mean difference, regression coefficient, odds ratio, correlation coefficient, etc. |
| effect size, | Cohen’s d, η², odds ratio, risk ratio, etc. |
| Uncertainty | 95% confidence interval, standard error, credible interval, etc. |
| p-value. | Report as reference information on statistical significance |
| Interpretation | Distinguish statistical significance from practical significance |
For example, writing only “there was a significant difference between Group A and Group B” is insufficient. A statement such as “the mean score in Group A was 5.2 points higher than in Group B; the 95% confidence interval for the mean difference was 1.1 to 9.3, and Cohen’s d was 0.48” allows readers to understand the direction, magnitude, and uncertainty of the difference.
Examples of reporting statistical analysis results
When statistical inference beyond the p-value is emphasized, reporting becomes more concrete. The following examples can be adapted for undergraduate theses, master’s theses, journal submissions, and research reports.
- The mean score in the intervention group was 5.2 points higher than that in the control group, and the 95% confidence interval for the mean difference was 1.1 to 9.3. The p-value was 0.014, and the effect size was moderate.
- The difference between the two groups was not statistically significant; however, the effect size was small to moderate, and the confidence interval included differences that may be practically meaningful.
- Correlation analysis showed a positive correlation between Scale A and Scale B (r = .42, p = .003).
- Logistic regression analysis showed that years of experience were associated with the outcome. The odds ratio was 1.38, with a 95% confidence interval of 1.08 to 1.76.
- In this study, we considered not only p-values but also effect sizes and confidence intervals, interpreting the findings in light of both their magnitude and uncertainty.
The key is not to stop at whether a result is statistically significant. Combining the estimate, effect size, confidence interval, and research context makes statistical findings easier for readers to understand.
Common problematic statements about p-values
P-values are frequently misinterpreted. In particular, a p-value should not be described as “the probability that the hypothesis is correct” or “the probability that the result is due to chance.” It is also important to avoid treating 0.05 as a sharp boundary that divides findings into valuable and worthless results.
- Because p = 0.03, the research hypothesis is 97% likely to be correct.
- Because p = 0.04, this result will definitely be reproduced.
- Because p = 0.06, the result is completely meaningless.
- Because there was no statistically significant difference, the two groups are completely identical.
- Because the p-value is small, the effect must be large.
- Only the presence or absence of statistical significance is reported without considering sample size or power.
- Only p-values are listed in the table without confidence intervals or effect sizes.
- A statistically significant result from exploratory analysis is reported as though a prespecified hypothesis had been confirmed.
To report statistical findings correctly, it is important to understand the limited meaning of p-values and interpret them together with effect sizes and confidence intervals. In undergraduate theses, master’s theses, and journal submissions in particular, statistical significance should be distinguished from practical significance.
Statistical-inference support available from Stat Agent
Stat Agent supports statistical analysis, effect-size calculation, organization of confidence intervals, interpretation of statistical tests, regression analysis, analysis of variance, correlation analysis, logistic regression, survey analysis, and report preparation for undergraduate theses, master’s theses, doctoral dissertations, journal submissions, medical papers, nursing research, psychology research, education research, social surveys, corporate surveys, and municipal surveys.
For support with statistical inference beyond the p-value in particular, we emphasize checking not only p-values but also effect sizes, confidence intervals, sample size, statistical power, validity of analytical methods, consistency with research objectives, and how results should be reported in the paper. We organize these elements so that the findings are communicated clearly to readers.
We can also provide specific consultation for concerns such as “I am unsure how to interpret the p-value,” “I do not know how to write up a non-significant result,” “I want to include effect sizes and confidence intervals in my paper,” “a reviewer said that p-values alone are insufficient,” or “I want to reflect the statistical analysis appropriately in the Methods, Results, and Discussion,” based on your research objective and data.
Frequently Asked Questions
Q1. If p < 0.05, is the result always important?
Not necessarily. A p-value is reference information for assessing statistical significance; it does not directly indicate effect magnitude or practical meaning. To judge the importance of a finding, the effect size, confidence interval, research objective, and practical context should also be considered.
Q2. If p ≥ 0.05, does the research finding have no meaning?
No. Even when p ≥ 0.05, important implications may remain depending on the effect size, confidence interval, sample size, and study design. In exploratory or small-sample research in particular, it is important not to stop at “no statistically significant difference,” but to describe carefully the magnitude of the observed difference and the uncertainty around it.
Q3. Should effect sizes always be reported?
In many studies, it is desirable to report effect sizes in addition to p-values. Effect sizes make it easier for readers to understand the magnitude of differences or associations. The appropriate effect-size measure, however, depends on the analysis method and study design.
Q4. How should confidence intervals be interpreted?
A confidence interval represents uncertainty around an estimate. Examining the confidence interval in addition to the point estimate helps assess precision and the range of plausible interpretations. A wide confidence interval may indicate substantial uncertainty in the estimate.
Q5. Can Bayesian statistics replace p-values?
Bayesian statistics provides a different framework from p-value-centered inference, but it is not a simple replacement. Bayesian analysis combines a prior distribution with data to obtain a posterior distribution. Because the choice of prior and the validity of the model must be explained, Bayesian methods should be used appropriately according to the research objective.
Summary | Statistical inference beyond the p-value helps us read research findings more responsibly
Statistical inference beyond the p-value does not mean abandoning p-values. It means placing them appropriately within a broader interpretation that integrates effect size, confidence intervals, statistical power, sample size, Bayesian perspectives, reproducibility, and research context.
A p-value is one indicator for reading statistical analysis results. However, the p-value alone does not reveal the magnitude of an effect, precision of an estimate, practical significance, or reproducibility of the research. Therefore, we need to ask not simply “is it significant?” but “how large is the observed effect, how much uncertainty surrounds it, and what does it mean in light of the research objective?” This broader question is essential.
Stat Agent provides support for statistical analysis, calculation of effect sizes and confidence intervals, interpretation of p-values, reporting of statistical results, organization of the Methods, Results, and Discussion, and analytical support for journal submissions, undergraduate theses, master’s theses, and research reports. I want to report statistical results without relying solely on p-values.、 I want to discuss non-significant results carefully.、 I want statistical inference that I can explain to reviewers or my academic supervisor. Please feel free to contact us in these situations.
