
How to Write the Statistics Section of an Undergraduate or Master's Thesis — AI Analysis: Common Mistakes —
For students unsure how to write the statistics section of an undergraduate or master's thesis and what to avoid when using AI-assisted analysis
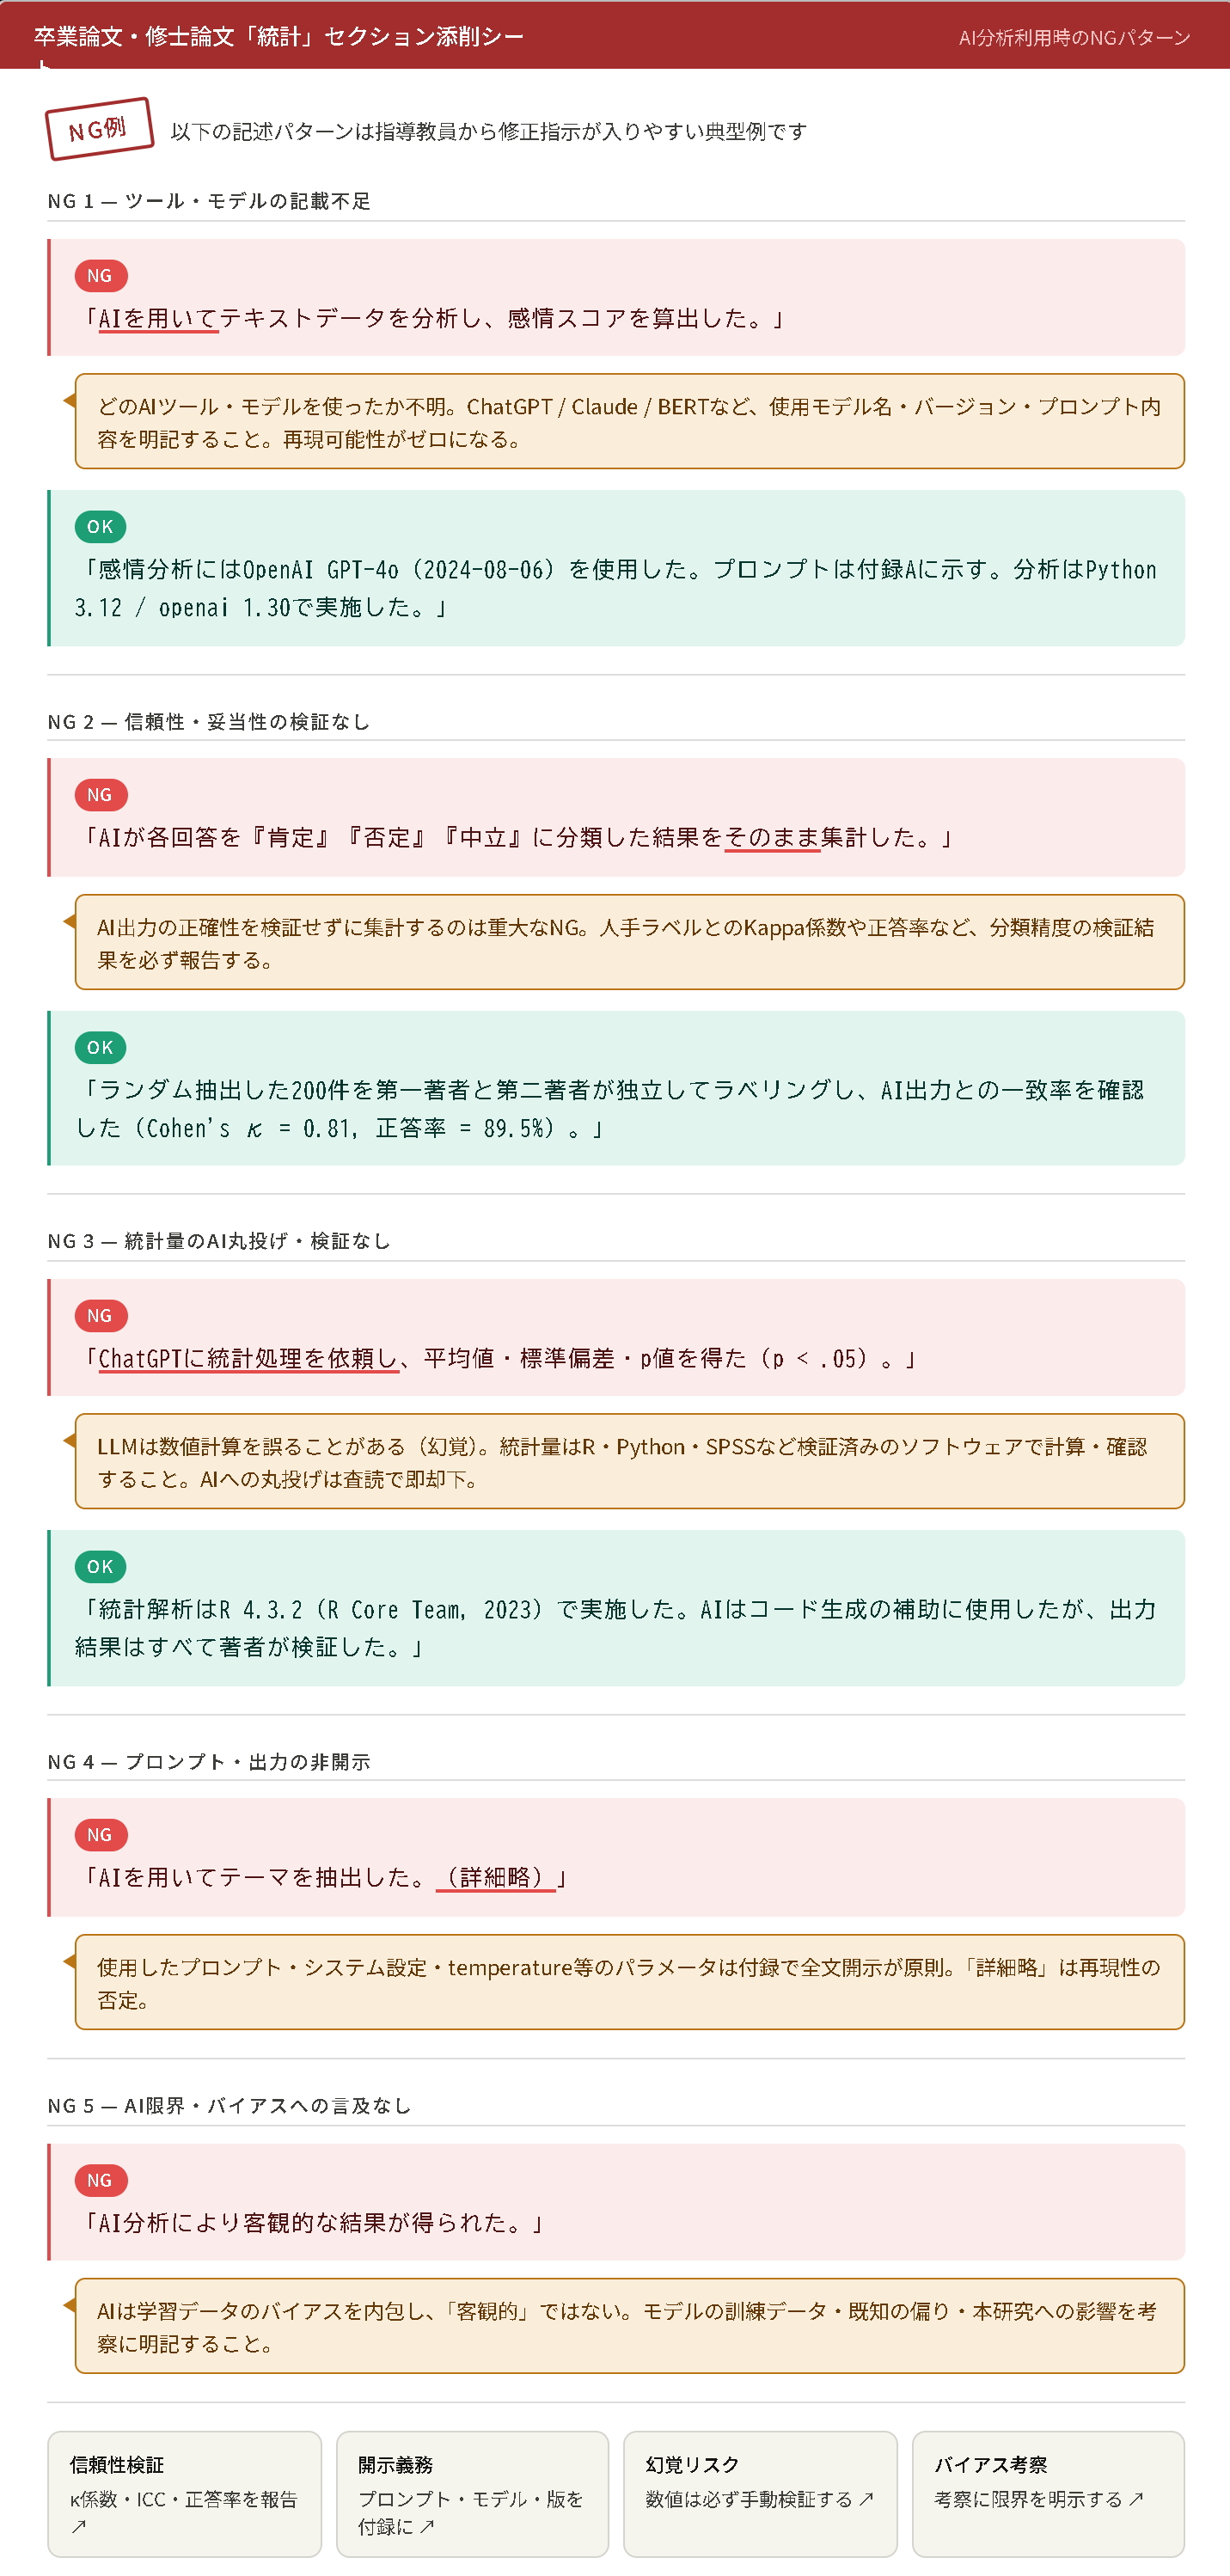
In undergraduate and master's theses involving questionnaires, experiments, observational studies, educational research, psychological scales, medical or nursing research, marketing research, and similar projects, one issue almost always arises: "How should I write the statistics section?" Even if statistical software produces p-values and means, simply pasting the output into a thesis does not provide a sufficient research explanation.
In recent years, more students have used generative AI and AI analysis tools to suggest statistical methods, explain results, prepare tables, or draft text. AI can be useful, but it also carries the risk of producing plausible statistical methods or interpretations without accurately understanding the structure of the data . In undergraduate and master's theses, supervisors may ask questions such as, "Why did you use that test?", "What does this p-value mean?", or "Did you merely have AI generate this?"
This article is intended for readers considering how to write statistics undergraduate thesis、 how to write statistics master's thesis、 undergraduate thesis statistical analysis、 master's thesis statistical analysis、 AI analysis mistakes、 AI statistical analysis cautions、 how to write statistical results For readers searching for topics such as these, this article explains how to write the statistical section of undergraduate and master's theses and gives concrete examples of what not to do when using AI-assisted analysis.
The first point to understand is that AI can assist with statistical analysis, but it is not the entity that should make the final judgment about the research objective, data structure, measurement scale, or validity of analytical methods . Rather than using AI-suggested methods or wording without verification, always confirm that they match the research objective, study design, and characteristics of the data.
- • Why the Statistics Section Matters in Undergraduate and Master's Theses
- • What to Include in the Statistics Section of Undergraduate and Master's Theses
- • What Not to Do with AI-Assisted Analysis
- • How to Write Statistical Analysis in Methods
- • How to Write Statistical Results in the Results Section
- • Statistical Method Selection Errors Common in AI-Assisted Analysis
- • Cautions for Questionnaire and Scale Research
- • Differences Between SPSS, R, Excel, and AI Output
- • Statistical Phrasing to Avoid in Undergraduate and Master's Theses
- • Checklist for Using AI Safely as an Assistant
- • How to Write Statistics You Can Explain to Supervisors and Reviewers
- • Statistical Analysis Support Available from Stat Agent
- • Frequently Asked Questions
- • Summary
Why the Statistics Section Matters in Undergraduate and Master's Theses
Statistical analysis is used in undergraduate and master's theses as evidence supporting research claims. If you claim, for example, that Group A differs from Group B, satisfaction is associated with intention to continue, scores improved after an intervention, or a particular factor affects an outcome, the claim should be supported by data rather than impression alone.
If the statistics section is weak, the credibility of the entire study can appear low. Even when the topic and literature review are carefully developed, vague analytical methods or results leave the question "Can this conclusion really be supported by the data?" unresolved.
Statistics Provides the Evidence for Research Findings
Statistical analysis provides objective support for findings in a thesis. The statistics section should therefore allow readers to follow what was compared, which variables were used, which tests were applied, and the magnitude of observed differences or associations.
Even if AI is used to improve the writing, polished prose is not meaningful if the underlying numbers or methods are incorrect. If the statistical method does not fit the data, the thesis remains unconvincing regardless of how polished the wording appears.
Organize the Research Objective Before Choosing a Statistical Method
Statistical methods should be chosen by working backward from the research objective. The appropriate method differs depending on whether you want to compare means, compare proportions, examine relationships between variables, or adjust for multiple factors simultaneously.
For example, t-tests or Mann–Whitney U tests may be considered for comparing means between two groups, while ANOVA may be used for three or more groups. Correlation or regression may be used to examine relationships between variables. Before asking AI, clarify "what your research is trying to determine" .
What to Include in the Statistics Section of Undergraduate and Master's Theses
At minimum, the statistics section should clearly state the analysis sample, variables, statistical methods, software used, numerical results, and appropriate scope of interpretation. Methods explains how the analysis was performed, Results reports what was found, and Discussion explains how those findings can be interpreted.
| Section | What to Include |
|---|---|
| Methods | Sample size, variables used, handling of missing data, statistical methods, software, and significance level |
| Results | Means, standard deviations, proportions, correlation coefficients, regression coefficients, p-values, 95% confidence intervals, effect sizes, etc. |
| Discussion | Meaning of the findings, relationship to previous research, consistency with hypotheses, study limitations, and future directions |
| Tables & Figures | Participant characteristics, descriptive statistics, group comparisons, correlation tables, regression tables, graphs, etc. |
A common AI-related mistake is mixing Methods and Results. Writing only "AI analysis showed a significant difference" does not explain what was analyzed or how. Undergraduate and master's theses should separate the rationale and procedure for selecting methods from the numerical results obtained.
What Not to Do with AI-Assisted Analysis
The greatest risk of AI-assisted analysis is that natural-sounding language can make incorrect content appear correct. Statistical methods cannot be selected appropriately without checking the data structure, measurement scale, sample size, missing values, paired or independent design, outliers, and research design.
Mistake 1: Asking AI for a Test Name Without Showing the Data Structure
Simply asking AI, "I conducted a questionnaire survey; what test should I use?" is not enough. Questionnaire data can include nominal, ordinal, continuous, open-ended, multiple-response, and paired data. Asking only for a test name without organizing the data type can lead AI to suggest an inappropriate method.
A better approach is to organize the research objective, hypothesis, variable names, measurement scales, number of groups, whether observations are paired, sample size, and missing-data status, and then evaluate candidate methods.
Mistake 2: Using Fabricated Results Generated by AI
If asked to "write an example of statistical results," AI may generate plausible means, p-values, correlation coefficients, and regression coefficients. Values not based on actual data must not be used in a thesis. This is not merely a writing issue; it is a serious research-integrity concern.
Statistical results must be calculated from actual data using software such as SPSS, R, EZR, Stata, or Excel. AI can assist with reading output or drafting explanations, but its role is not to create numbers that do not exist。
Mistake 3: Letting AI Draw Conclusions from p-Values Alone
AI may generate statements such as, "Because p<0.05, the hypothesis was supported." However, it is risky to determine a research conclusion from the p-value alone. Effect size, confidence intervals, sample size, measurement scale, research design, confounders, and consistency with prior research should all be considered.
Master's theses in particular are expected to discuss not only statistical significance but also theoretical meaning, practical importance, and study limitations.
How to Write Statistical Analysis in Methods
Methods should describe the statistical procedures clearly enough for readers to understand them. In undergraduate and master's theses, it is more important to explain methods that fit the research objective and data than to fill the section with unnecessarily difficult terminology.
For example, in research using five-point scales, you may state that total or mean scale scores were calculated, Cronbach's alpha was computed to assess reliability, t-tests were used for group comparisons, and correlation or multiple regression analysis was performed to examine relationships among variables.
| Item | Example Methods Wording |
|---|---|
| Descriptive Statistics | Means, standard deviations, counts, and percentages were calculated for participant characteristics and each scale score. |
| Reliability Analysis | Cronbach's alpha was calculated to assess the internal consistency of each scale. |
| Group Comparisons | An independent-samples t-test was used to compare mean values between two groups. |
| Assessment of Associations | Pearson's product-moment correlation coefficient was calculated to examine relationships between scale scores. |
| Software | Statistical analyses were performed using SPSS Statistics version XX or R version X.X.X, with a significance level of 5%. |
A mistake when asking AI to write Methods is allowing it to describe analyses that were never actually performed. If multiple regression was not conducted, the thesis cannot state that it was. Methods should describe only analyses that were actually performed, in sufficient detail to make the procedure reproducible.
How to Write Statistical Results in the Results Section
Results should present statistical findings objectively. Rather than stating only "significant" or "not significant," report concrete values such as means, standard deviations, percentages, correlation coefficients, regression coefficients, and p-values.
For example, for a t-test: "The mean score was 4.12 ± 0.68 in Group A and 3.75 ± 0.72 in Group B, and Group A scored significantly higher (p=0.021)." For correlation analysis: "Self-efficacy scores and learning-satisfaction scores showed a significant positive correlation (r=0.43, p=0.004)."
A common AI-related problem is wording that is too abstract. A sentence such as "analysis confirmed a significant trend" does not say which variables were related, how large the difference was, or what the p-value was. Undergraduate and master's theses should report concrete numbers without making stronger claims than the data support .
Statistical Method Selection Errors Common in AI-Assisted Analysis
AI can naturally produce the names of statistical methods while still recommending procedures that do not fit the data. Common problem areas include distinguishing paired from independent data, nominal from ordinal scales, deciding whether a normality assumption is reasonable, and handling small sample sizes.
| Research Situation | Point to Check |
|---|---|
| Before-and-after measurements from the same participants | Consider a paired t-test or Wilcoxon signed-rank test rather than an independent t-test. |
| Comparison of separate groups, such as men and women | Treat the observations as independent and consider an independent t-test or Mann–Whitney U test. |
| Comparison of Categorical Variables | Consider counts and percentages, chi-square tests, or Fisher's exact test rather than means. |
| Five-point scales | Treatment differs depending on whether the value is a single item or a composite score made from multiple items. |
| Examining Multiple Factors | Multiple regression or logistic regression may be needed rather than simple correlation alone. |
Even if AI answers, "Use a t-test," that answer is not necessarily correct. It is important not only to know the method name but also to be able to explain why the method is appropriate.
Cautions for Questionnaire and Scale Research
Undergraduate and master's theses often use Google Forms or paper questionnaires. In such studies, it matters whether responses can appropriately be averaged, whether a composite scale score is justified, whether reverse-coded items were processed, and whether reliability was assessed.
One AI-analysis mistake is to treat a single five-point item like a continuous variable and apply unnecessarily complex methods. In contrast, a multi-item scale may legitimately be summarized as a total or mean score after reliability is checked. If this distinction is not understood, AI-assisted analyses can produce unnatural methods and results.
For questionnaire research, first organize the items, response options, measurement scales, missing values, reverse-coded items, and scoring rules. Then select descriptive statistics, reliability analysis, factor analysis, correlation, group comparison, regression, or other methods according to the research objective.
Differences Between SPSS, R, Excel, and AI Output
Undergraduate and master's research uses tools such as SPSS, R, Excel, EZR, jamovi, and JASP. These are tools for performing statistical analysis, whereas AI is mainly useful for assisting with explanation and drafting. AI is therefore not a replacement for statistical software.
| Tool | Primary Role |
|---|---|
| SPSS | Convenient for menu-based descriptive statistics, tests, correlation, regression, factor analysis, and related procedures. |
| R | Supports highly reproducible code-based analysis, advanced statistical models, and flexible figure preparation. |
| Excel | Useful for data organization, simple tabulation, and graphs, but requires caution for advanced statistical analysis. |
| AI | Useful for explaining statistical concepts, drafting text, and assisting with interpretation, but outputs require verification against actual data. |
When AI output is used, always verify the software, procedure, and actual analytical results. "Because AI said so" is not a valid justification in an undergraduate or master's thesis. Keep a record of which software, data, and method were used so that you can explain the analysis to your supervisor.
Statistical Phrasing to Avoid in Undergraduate and Master's Theses
Do not overstate statistical findings. Statistical analysis provides evidence that supports research findings, but claims beyond what the analysis can establish reduce the credibility of the thesis.
- "AI analysis completely proved the hypothesis."
- "Because p<0.05, there must be an effect."
- "Because the result was not significant, there is absolutely no relationship."
- "Because there is a correlation, there is a causal relationship."
- "We used this method because AI judged it to be optimal."
- "We accepted the statistical software output as-is."
More appropriate expressions include "a significant association was observed," "a difference was found within the scope of this study," "causal interpretation is limited," and "future research with a larger sample is needed." Particularly when AI is used, the researcher, not the AI, should be the one who verifies and interprets the results .
Checklist for Using AI Safely as an Assistant
Using AI as a supplementary tool in the statistical section of an undergraduate or master's thesis can be useful if done appropriately. It can help organize candidate methods, explain software output, improve Methods or Results wording, and clarify the meaning of p-values and confidence intervals.
- Are all reported analytical results based on actual data?
- Have you avoided using fabricated p-values or means generated by AI?
- Have you confirmed the variables' measurement scales, number of groups, and whether observations are paired?
- Have you recorded the name and version of the statistical software used?
- Can you explain the analytical procedure yourself?
- Have you examined effect sizes and confidence intervals in addition to p-values?
- Have you revised AI-generated wording to match the actual study?
- Have you avoided entering personal information or unpublished data into AI without proper authorization?
AI can assist with drafting and verification, but research ethics, privacy, data protection, and analytical reproducibility must be considered. Particular care is needed before entering questionnaire or medical data containing personal information into AI systems.
How to Write Statistics You Can Explain to Supervisors and Reviewers
Ultimately, undergraduate and master's researchers must be able to explain to supervisors and examiners why a particular analysis was performed. This requires understanding not only the method name but also its relationship to the research objective, the nature of the data, and the meaning of the results.
For example, being able to say, "We used a t-test to compare the means of two groups," "We used correlation analysis to examine associations between scale scores," or "We used multiple regression to examine several factors simultaneously" makes the statistical section more persuasive.
Even when AI-assisted analysis is used, the explanation should not be "AI chose the method," but rather that you judged the method to be appropriate in light of your research objective and data structure .
Statistical Analysis Support Available from Stat Agent
Stat Agent supports statistical analysis, data preparation, SPSS analysis, R analysis, EZR analysis, questionnaire tabulation, chart preparation, and organization of Methods and Results for undergraduate theses, master's theses, doctoral dissertations, journal articles, nursing research, psychology research, education research, social-science research, business surveys, local-government surveys, and more.
As AI-assisted analysis becomes more widespread, what matters is not plausible AI-generated prose but statistical reporting based on actual data that you can explain to your supervisor . Stat Agent reviews statistical software output while helping organize results into tables, figures, and text suitable for academic work.
If you are unsure whether an AI-generated analysis is correct, do not know how to write SPSS results in your thesis, cannot choose an appropriate method for questionnaire data, or want to improve the statistics section of your undergraduate or master's thesis, we can provide specific advice based on the research objective and data.
Frequently Asked Questions
Q1. Can I have AI write the statistics section of my undergraduate thesis?
AI can assist with wording, but the validity of the statistical methods and all numerical results must be verified using actual data. Fabricated p-values, means, correlation coefficients, or references generated by AI must not be used.
Q2. Can I trust statistical methods suggested by AI?
They can be useful as a reference, but they are not necessarily correct. The research objective, variable types, measurement scales, number of groups, paired or independent design, sample size, and missing-data status must be checked. If uncertain, consult your supervisor or a statistical-analysis specialist.
Q3. Is it a problem to use AI-generated wording for statistical results as-is?
It is a problem if the text does not accurately reflect results based on real data. Natural-sounding language does not make incorrect numbers or interpretations appropriate for a thesis. AI output should always be checked against the actual analysis, tables, graphs, and research objective and revised accordingly.
Q4. Does a lack of statistical significance make an undergraduate or master's thesis weak?
Not necessarily. A nonsignificant result can still be meaningful if carefully discussed in terms of sample size, effect size, confidence intervals, measurement methods, and prior research. Research value should not be judged by the p-value alone.
Q5. If I use AI-assisted analysis, do I need to disclose it in the thesis?
This depends on the policies of your university or research institution. If rules on generative AI use have been established, follow them. At minimum, statistical results themselves should be based on actual data and statistical software, with AI limited to supporting explanation or organization of wording.
Summary | In the AI Era, Undergraduate and Master's Theses Need Statistics You Can Explain
The statistics section of an undergraduate or master's thesis should consistently report the research objective, variables, analysis sample, software, statistical methods, numerical findings, and appropriate scope of interpretation rather than merely listing method names and p-values. AI-assisted analysis is convenient, but it creates risks such as choosing tests based on misunderstood data structures, fabricating values, or drawing conclusions from p-values alone.
The important point is not to use AI-generated prose for its own sake, but to produce statistical reporting based on your own research data that you can explain to supervisors and readers . AI can be used as an assistant, but humans must ultimately verify the research objective, data, analytical results, and validity of the interpretation.
Stat Agent supports statistical analysis for undergraduate and master's theses, questionnaire tabulation, SPSS/R/EZR analysis, table and graph preparation, organization of Methods and Results, verification of AI-assisted analytical output, and checks on the appropriateness of statistical methods. I am worried that the statistics section generated with AI may be wrong、 I want to write the statistical results of my undergraduate or master's thesis correctly、 I want an analysis I can explain to my supervisor Please feel free to contact us in these situations.
