
Recommended Statistical Software for Academic Research
For those unsure which statistical software to choose for university or graduate research, journal submissions, medical and nursing research, psychology, education, and social-science data analysis
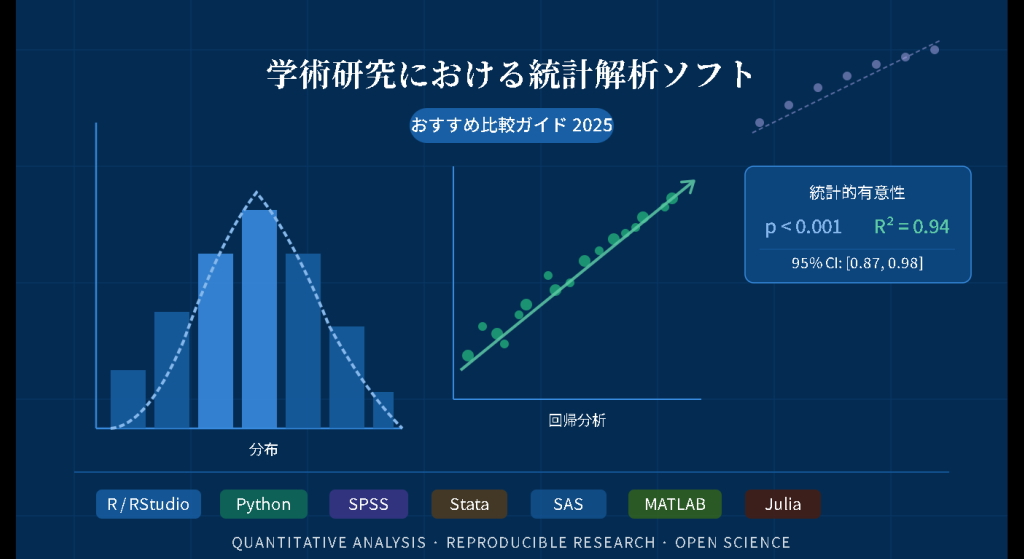
When conducting statistical analysis for academic research, one of the first questions many researchers face is "Which statistical software should I use?" There are many options, including SPSS, R, EZR, Stata, JMP, jamovi, JASP, and GraphPad Prism. Each differs in its strengths, ease of use, cost, reproducibility, and suitability for academic publishing.
However, recommendations for statistical software cannot be reduced to a simple popularity ranking. Graduation theses, master's theses, doctoral dissertations, journal articles, KAKENHI-funded research, medical studies, nursing research, psychometric scale research, questionnaire surveys, and reports for companies or local governments all differ in the analytical rigor, accountability, and table and figure formats required. Therefore, when choosing statistical software for academic research, it is necessary to consider the research objective, data type, analytical methods, target journal requirements, reproducibility, and the user's statistical experience together.
This article is intended for readers considering recommended statistical software academic research、 statistical software comparison、 SPSS recommendation、 R statistical analysis、 EZR statistical analysis、 Stata academic papers、 how to use jamovi、 JASP statistics For readers searching for topics such as these, this article explains how to choose statistical software that is practical in research settings.
The first point to understand is that Statistical software is not a tool that automatically performs analysis correctly; it is a working environment for explaining a research question numerically . Regardless of the software used, errors in variable specification, missing-data handling, group definition, statistical tests, or multivariable model design can make the interpretation of research findings unstable. Research design and the analysis plan should therefore be organized at the same time as software selection.
- • What to Check Before Choosing Statistical Software
- • Comparison of Major Statistical Software Used in Academic Research
- • Recommended Statistical Software for Beginners, Undergraduates, and Graduate Students
- • Recommendations When Journal Submission and Peer-Review Responses Matter
- • Statistical Software Suitable for Medical, Nursing, and Clinical Research
- • Choosing Software for Psychology, Education, and Social-Science Research
- • Choosing Software for Business, Local-Government, and Marketing Research
- • Data Preparation Before Introducing Statistical Software
- • Statistical Software Information to Report in a Paper's Methods Section
- • Common Mistakes When Choosing Statistical Software
- • Statistical Analysis Support Available from Stat Agent
- • Frequently Asked Questions
- • Summary
What to Check Before Choosing Statistical Software
The first question when choosing statistical software should not be whether the software is famous. What matters is whether it can correctly perform the analyses required for the research objective and whether the results can be explained in a paper or report. For simple questionnaire tabulation, Excel or SPSS may be sufficient. However, for factor analysis, structural equation modeling, logistic regression, Cox regression, propensity score analysis, mixed-effects models, meta-analysis, and similar methods, it is necessary to check the capabilities of each package.
In academic research, it is also important not merely to obtain analytical results but to be able to explain to reviewers, supervisors, and collaborators "what procedure was used to conduct the analysis" . Researchers therefore need to decide, based on the stage and needs of the project, whether to prioritize software that is easy to use through menus or software that makes it easy to preserve reproducible code.
Define the Research Objective and Outcome First
Before choosing statistical software, clarify the primary outcome. The required method changes depending on whether the outcome is a difference in means, a difference in proportions, strength of association, a predictive model, or time to an event. For example, software-selection priorities differ between research centered on t-tests and ANOVA and research centered on logistic regression or survival analysis.
If software is chosen while the research objective remains vague, problems can arise later, such as discovering that the required analysis is unavailable, that output tables are difficult to format for a paper, or that additional analysis requested during peer review cannot be performed. Software selection should therefore be considered together with the analysis plan.
Consider Reproducibility, Not Only Ease of Use
Reproducibility is important in academic research. It means that the same result can be obtained again when the same data and procedures are used. Software such as R and Stata makes it relatively easy to preserve code, which helps researchers review analysis procedures later. In contrast, software such as SPSS, JMP, jamovi, and JASP is easy for beginners to use through graphical interfaces, but operation steps and output management need to be documented carefully.
Rather than one approach being universally better, usability may matter most for undergraduate and master's theses, reproducibility for journal articles and collaborative research, and extensibility for complex analyses . Adjusting priorities to the stage of the research is a practical approach.
Comparison of Major Statistical Software Used in Academic Research
Major statistical packages used in academic research have distinct characteristics. The following table summarizes representative software in a way that helps researchers and graduate students compare options.
| Statistical Software | Research Areas and Features for Which It Is Well Suited |
|---|---|
| SPSS | Easy to use in psychology, education, nursing research, social surveys, and questionnaire analysis. Menu-based operation makes it relatively approachable for beginners performing basic tests and regression analyses. |
| R | Free to use and strong in statistical analysis, graphics, and reproducible workflows. Well suited to journal submissions, reanalysis, complex models, and package-based extensions. |
| EZR | An R-based environment oriented toward medical statistics. It provides many functions useful in clinical research, including survival analysis, ROC curves, meta-analysis, and sample-size calculation. |
| Stata | Well suited to epidemiology, economics, social sciences, policy research, and panel-data analysis. Strong for reproducible command-based analysis and reporting. |
| JMP | Strong in design of experiments, quality control, exploratory data analysis, and visualization. Well suited to manufacturing, R&D, and in-house business analytics. |
| jamovi | Free and easy to install, with an interface similar to SPSS. Built on R and suitable for beginners learning statistics, classroom use, and basic analyses for undergraduate theses. |
| JASP | Free and easy to use, particularly for basic analyses in psychology and the social sciences. It also provides accessible Bayesian analysis and output suited to APA-style reporting. |
| GraphPad Prism | Well suited to life sciences, pharmacy, experimental medical data, graph preparation, t-tests, ANOVA, nonlinear regression, and survival analysis. |
The important point in this comparison is not only that each package supports different analyses, but also that they differ in how results are presented, how analyses are reproduced, and how findings are incorporated into a paper . The best software may differ depending on whether the final output is an undergraduate thesis, journal article, conference presentation, or a report for government or business.
Recommended Statistical Software for Beginners, Undergraduates, and Graduate Students
When performing statistical analysis for the first time, ease of operation is extremely important. If researchers try to learn code and package management before statistical concepts are well established, they may struggle more with environment setup than with the analysis itself. For the early stages of undergraduate or master's research, software such as SPSS, jamovi, and JASP may therefore be useful because it allows analysis results to be checked easily through graphical interfaces .
When SPSS Is a Good Fit
SPSS is widely used in university and graduate courses and in psychology, education, nursing, social welfare, social surveys, and questionnaire analysis. It allows users to run t-tests, ANOVA, correlation analysis, regression analysis, factor analysis, cross-tabulation, and other procedures from menus, making output relatively easy for statistical beginners to review.
A further advantage is that, when supervisors or laboratories already use SPSS, it is easier to obtain help with operation and interpretation of output tables. Licensing costs and availability vary by university and organization, however, so individual users should confirm access in advance.
When jamovi or JASP Is a Good Fit
jamovi and JASP are free, easy to install, and allow statistical beginners to conduct analyses through graphical interfaces. They are practical options for learning descriptive statistics, t-tests, ANOVA, correlation, regression, reliability analysis, and other foundational methods.
jamovi is an R-based environment that makes it easier to move from point-and-click operation toward an understanding of R. JASP combines an intuitive interface with accessible classical and Bayesian statistics. Both are convenient options for statistics courses, basic undergraduate-thesis analysis, and exercises in psychology or education.
Recommendations When Journal Submission and Peer-Review Responses Matter
When journal submission or peer-review revision is anticipated, simply obtaining analytical results is not enough. Reviewers may ask which variables were adjusted for, how missing values were handled, whether sensitivity analyses were performed, and whether the analysis can be reproduced. For journal articles, it is therefore important to use statistical software that makes it easy to document procedures and preserve reproducibility .
R is suitable for reproducibility-focused research because the complete analysis procedure can be retained as scripts. It is highly extensible for research purposes, including graphics with ggplot2, survival analysis with the survival package, logistic regression with glm, multiple imputation with packages such as mice, and propensity-score approaches using packages such as MatchIt or WeightIt.
Stata also makes it easy to preserve analytical procedures using commands and do-files and is widely used for journal articles in epidemiology, economics, policy research, and the social sciences. It supports integrated management of data processing, regression analysis, panel data, survival analysis, figures, and reporting.
SPSS users can also improve reproducibility by saving Syntax and documenting menu operations. For journal submissions, more important than which software is used is preserving the analysis in a form that can be explained to a third party .
Statistical Software Suitable for Medical, Nursing, and Clinical Research
Medical, nursing, and clinical research frequently requires patient-characteristics tables, between-group comparisons, logistic regression, Cox proportional hazards models, Kaplan–Meier curves, log-rank tests, ROC curves, and sample-size calculations. It is therefore useful to choose software that supports medical statistics effectively.
EZR is known as an R- and R Commander-based environment designed for medical statistics. Its menus organize analyses commonly used in medical research, including survival analysis, ROC curves, meta-analysis, and sample-size calculations, making it a practical option for physicians, nurses, graduate students, and health researchers conducting clinical studies.
GraphPad Prism is well suited to life-science, pharmaceutical, and experimental research that combines statistical analysis with publication-quality graphs. It is convenient when researchers want to perform t-tests, ANOVA, nonlinear regression, survival analysis, and related procedures while creating figures suitable for papers and conference presentations.
When more complex multivariable analyses, missing-data handling, propensity score analysis, sensitivity analysis, or reproducible workflows for journal submissions are required, R or Stata may also be appropriate. In medical statistics, the analysis plan should be determined not only by software name but by the research design, endpoint, sample size, number of events, and handling of confounders .
Choosing Software for Psychology, Education, and Social-Science Research
Research in psychology, education, social welfare, sociology, business administration, and related fields commonly uses questionnaire surveys, scale scores, factor analysis, reliability analysis, correlation analysis, multiple regression, ANOVA, and structural equation modeling. SPSS, jamovi, JASP, and R are common options in these areas.
SPSS is convenient for questionnaire tabulation, basic hypothesis tests, factor analysis, and multiple regression and may be frequently used by supervisors or in prior studies. jamovi and JASP are free, easy to introduce, and suitable for statistics education and foundational analysis. R becomes a strong option for advanced research involving psychometrics, structural equation modeling, multilevel analysis, text analysis, and related methods.
For example, a five-point Likert questionnaire in an undergraduate thesis might be analyzed in SPSS or jamovi using descriptive statistics, reliability coefficients, correlation analysis, and multiple regression. For doctoral dissertations or journal articles involving model fit, mediation, longitudinal data, or hierarchical data, packages such as lavaan, lme4, and brms in R may be considered.
Choosing Software for Business, Local-Government, and Marketing Research
Business and local-government research differs somewhat from academic research because deliverables that support decision-making, visualization, and reporting are especially important. In customer-satisfaction studies, employee surveys, resident surveys, web marketing, and purchasing-data analysis, statistical accuracy must be accompanied by charts and tables that stakeholders can understand.
JMP is well suited to exploratory data analysis, visualization, design of experiments, quality improvement, and R&D. It is particularly useful for visually examining patterns, generating hypotheses, and connecting findings to improvement initiatives.
SPSS is convenient for questionnaires, customer analysis, cross-tabulation, and regression and can also be useful for producing summary tables for reports. R and Python are useful when datasets are large, processing needs to be automated, or analyses need to connect with dashboards or machine learning. For businesses and local governments, software selection should be accompanied by a clear analytical story that connects results to decisions .
Data Preparation Before Introducing Statistical Software
Statistical software cannot produce correct analysis if the data are not organized. Data cleaning before analysis is especially important in academic research. Variable names, value labels, missing values, outliers, duplicates, units, date formats, and inconsistent category labels should be checked in advance.
| Item to Check | Specific Points to Review |
|---|---|
| Variable Names | Whether Japanese, English, and abbreviations are mixed and whether variable names correspond to terminology used in the paper |
| Missing Values | Whether blanks, 999, NA, unanswered entries, and other missing-value codes are mixed |
| Categories | Whether values with the same meaning, such as Male, Man, and M, are coded inconsistently |
| Measurement Scale | Whether nominal, ordinal, interval, and ratio scales are being handled appropriately |
| Unit of Analysis | Whether each row clearly represents one person, one measurement, one facility, or another defined unit |
Entering poorly organized data into SPSS, R, EZR, Stata, or other software can cause import errors and incorrect tabulation before the statistical analysis even begins. In questionnaire and medical-record datasets in particular, input rules should be defined in advance.
Statistical Software Information to Report in a Paper's Methods Section
Journal articles should state the name and version of the statistical software, analyses performed, handling of variables, significance level, treatment of missing data, and related details in the statistical analysis section. Simply naming the software does not explain what was done, so the description should be specific to the research design.
| Item to Report | Examples of What to Report in Methods |
|---|---|
| Software | Name and version of statistical software used, such as SPSS, R, EZR, Stata, or JMP |
| Descriptive Statistics | Continuous variables were presented as mean ± standard deviation or median [interquartile range], and categorical variables as counts and percentages, for example. |
| Group Comparisons | Tests used, such as the t-test, Mann–Whitney U test, chi-square test, and Fisher's exact test |
| Multivariable Analysis | Models used, such as logistic regression, linear regression, Cox proportional hazards models, and mixed-effects models |
| Significance Level | For example, a two-sided p-value <0.05 was considered statistically significant |
Peer review focuses more on whether the analytical approach is appropriate than on the statistical software itself. Researchers should therefore be able to explain not only which software was used but why a particular test or model was selected, which variables were adjusted for, and how missing data were handled .
Common Mistakes When Choosing Statistical Software
A common mistake is choosing software only because it is free, famous, or already used in the laboratory. Ease of adoption and access to local support are certainly important, but they are not sufficient by themselves.
- Choosing software that does not support the required analytical method
- Pasting software output tables directly into a paper
- Running analyses without first checking missing data or outliers
- Using only menu operations without recording the analytical procedure
- Looking only at p-values without interpreting effect sizes or confidence intervals
- Failing to check the target journal's statistical reporting requirements
Statistical software is useful, but when research objectives and the analysis plan are vague, it can still produce plausible-looking numbers that are difficult to interpret. Academic research should aim to produce "results that validly answer the research question," not merely "results produced by software" .
Statistical Analysis Support Available from Stat Agent
Stat Agent supports research data from universities, graduate schools, medical institutions, research organizations, businesses, and local governments, including selection of statistical software, organization of analysis plans, data cleaning, tabulation, charting, statistical tests, multivariable analysis, preparation of publication-ready tables, and assistance with Methods and Results sections.
We consider analytical environments such as SPSS, R, EZR, Stata, and JMP based on the research content and emphasize preparing results in a form that can be explained in papers and reports, rather than merely carrying out statistical processing . We can also support questionnaire surveys, nursing research, medical research, psychometric-scale studies, education research, business and local-government surveys, and studies combining qualitative and quantitative data.
If you are unsure which statistical software to use, do not understand how to read SPSS output, want to create a reproducible workflow in R, want to perform medical statistics in EZR, or need to format tables for a journal article, we can review the research objective and state of the data and propose an appropriate analysis plan.
Frequently Asked Questions
Q1. What is the best statistical software for academic research?
It depends on the research objective. SPSS, jamovi, and JASP are often easy to use for beginners and questionnaire analysis, whereas R and Stata are strong options when journal submission and reproducibility are priorities. EZR, R, and GraphPad Prism may also be suitable for medical or clinical research. More important than the software name is performing the necessary analysis correctly and being able to explain the results.
Q2. Can I prepare a paper using only free statistical software?
In many cases, yes. R, EZR, jamovi, and JASP are easy to obtain and may be fully practical depending on the research. For journal submissions, however, the validity of analytical methods, reproducibility, preparation of tables and figures, and the Methods description are important. Even with free software, the analysis plan and interpretation of results require care.
Q3. Which is better, SPSS or R?
SPSS is easy to use through menus and well suited to basic statistical analysis and questionnaire research. R is strong in reproducibility, extensibility, complex analysis, and graphics, but requires learning code. A practical approach may be to use SPSS in the early stages of an undergraduate or master's thesis and R for journal submissions or advanced analysis.
Q4. Is EZR alone sufficient for medical research?
EZR can be very useful for basic medical statistics, survival analysis, ROC curves, and sample-size calculations. However, when complex missing-data handling, propensity score analysis, mixed-effects models, sensitivity analyses, or comprehensive reproducibility packages are needed, using R or Stata as well may be preferable.
Q5. Can I analyze data with statistical software even if I do not know statistics?
Software can make the operation possible, but basic statistical knowledge is still necessary to interpret results correctly. Understanding measurement scales, normality, paired versus independent data, confounders, sample size, missing values, effect sizes, and confidence intervals is especially important. Statistical software assists analysis; it does not replace research judgment.
Summary | Choose Statistical Software for Academic Research Based on Research Objectives and Accountability
The most appropriate statistical software for academic research varies by field and purpose. SPSS is accessible for beginners and questionnaire analysis; R is strong in reproducibility and extensibility; EZR is convenient for medical statistics; Stata is widely used in social science, epidemiology, and policy research; JMP is strong in exploratory analysis and R&D; and GraphPad Prism is useful for figures in the life sciences. jamovi and JASP are free and accessible entry points for learning statistics and conducting basic analyses.
However, the most important issue is not which software is used. Academic research requires selecting analyses that fit the research objective and being able to explain the results in papers, reports, and peer-review responses . Statistical software is a tool for supporting the research question, so software selection should be integrated with research design, data structure, and the analysis plan.
Stat Agent provides support from the software-selection stage through SPSS, R, EZR, and Stata analysis, questionnaire tabulation, qualitative analysis, preparation of publication-ready tables and figures, and organization of Methods and Results in line with the research objective. I do not know which software to use、 I want to prepare analysis results in a form suitable for a paper、 I want to make my statistical analysis robust enough for peer review Please feel free to contact us in these situations.
